NVIDIA Nsight Profilers
Overview
Teaching: 60 min
Exercises: 0 minQuestions
What is profiling? Why and how is it useful for parallelization?
What are NVIDIA Nsight Systems and Nsight Compute? What do they do and how can I use them?
What is the difference between Nsight Systems/Compute’s command line interface (CLI) and graphical user interface (GUI) profilers?
Objectives
Leaning the fundamentals of NVIDIA Nsight Systems CLI profiler
Basic familiarity with NVIDIA Nsight Systems GUI profiler
Mastering the basics of the NVIDIA Nsight Compute CLI profiler
NVIDIA Nsight Compute GUI profiler
Software/Hardware Specifications
All profiling chapters adopt the latest version of NVIDIA Nsight Systems (2021.3.1.54) and Nsight Compute (2021.2.2.0) at the time of writing this tutorial. The aforementioned version of Nsight Systems supports important emerging features such as Expert System designed for an automatic detection of performance optimization opportunities in parallel application’s profile within both Command Line- (CLI) and Graphical User Interface (GUI) frameworks.
Table of Contents
1. Overview
The present tutorial is a continuation of MolSSI’s Fundamentals of Heterogeneous Parallel Programming with CUDA C/C++ at the beginner level where we provide a deeper look into the close relationship between the GPU architecture and the application performance. Adopting a systematic approach to leverage this relationship for writing more efficient programs, we have based our approach on NVIDIA’s Best Practices Guide for CUDA C/C++. These best practices guidelines encourage users to follow the Asses, Parallelize, Optimize and Deploy (APOD) application design cycle for an efficient and rapid recognition of the parallelization opportunities in programs and improving the code quality and performance.
The NVIDIA Nsight family consists of three members:
- Nsight Systems: A comprehensive system-wide tool for the application performance analysis and optimization
- Nsight Compute: A professional tool for kernel-level performance analysis and debugging
- Nsight Graphics: An optimization and debugging software for graphical workflows such as rendering performance etc.
NVIDIA recommends developers to start the profiling process by using Nsight Systems in order to identify the most important and impactful system-wide opportunities for optimization and performance improvement. Further optimizations and fine-tunings at the CUDA kernel and API level can be performed through Nsight Compute. In our analysis for performance improvement and code optimization, we will adopt a quantitative profile-driven approach and make an extensive use of profiling tools provided by NVIDIA’s Nsight Systems and Nsight Compute.
2. NVIDIA Nsight Systems
NVIDIA Nsight Systems is a system-wide performance analysis tool and sampling profiler with tracing feature which allows users to collect and process CPU-GPU performance statistics. NVIDIA Nsight Systems recognizes three main activities: 1) profiling, 2) Sampling, and 3) tracing. The performance data collection is called profiling. In order to collect information on the timings spent on function calls during the program, the profiler periodically stops the application under investigation (profilee) to collect information on call stacks of active threads (backtraces). The sampling results are generally less precise when the number of samples are small. Tracing refers to the collection of precise quantitative information about a variety of activities that might be happening in profilee or the OS. The Nsight Systems collects the information in a profiling session which usually involves both sampling and tracing activities.
NVIDIA Nsight Systems offers two major interfaces, through which users can profile an application:
- Command-Line Interface (CLI)
- Graphical User Interface (GUI)
In the following sections, we overview the mechanics of using each method in details.
2.1. Command Line Interface Profiler
The general form of the Nsight Systems command line interface (CLI) profiler, nsys, is similar to that of nvprof we saw in MolSSI’s Fundamentals of Heterogeneous Parallel Programming with CUDA C/C++ at the beginner level
$ nsys [command_switch] [optional command_switch_options] <application> [optional application_options]
A list of possible values for command_switch and optional command_switch_options are provided in Nsight Systems s
User Manual. The <application> refers to the name of
the profilee executable.
Despite a rather complicated form mentioned above, the following command will be sufficient for the majority of our applications in this tutorial
$ nsys profile --stats=true <application>
Here, the --stats=true option triggers the post processing and generation of the statistical data summary collected by
the Nsight Systems profiler. For sample outputs from using the --stats option with CLI profiler in various OSs, see
the Nsight Systems’ documentation.
The CLI gathers the results in an intermediate .qdstrm file which needs to be further processed either by importing it in a GUI or using the standalone Qdstrm Importer in order to generate an optimized .qdrep report file. For portability reasons and future analysis of the reports on the same or different host machine and sharing the results, the .qdrep formant should be used.
Note:
In order to import a .qdstrm file in a GUI, the host GUI and CLI version must match. The host GUI is only backwards compatible with .qdrep files.
At the time of writing this tutorial, Nsight Systems attempts to convert the intermediate report files to their .qdrep report
counterparts with the same names after finishing the profiling run if the necessary set of required libraries are available.
See Nsight Systems’ documentation for further
details. It is important to note that setting the --stats option to True results in the creation of a SQLite database after the
collection of results by Nsight Systems. If a large amount of data is captured, creating the corresponding database(s) may require longer
than normal time periods to complete. For safety reasons, Nsight Systems does not rewrite the results on the same output files by default.
If intended otherwise, users can adopt the -f or --force-overwrite=true options to overwrite the (.qdstrm, .qdrep, and .sqlite) result files.
Let us run this command on the vector sum example from our beginner level GPU workshop. In order to be able to profile a program, an executable application file is required. Let’s compile our example code and run it
$ nvcc gpuVectorSum.cu cCode.c cudaCode.cu -o vecSum --run
The aforementioned command gives the following results
Kicking off ./vecSum

GPU device GeForce GTX 1650 with index (0) is set!

Vector size: 16777216 floats (64 MB)

Elapsed time for dataInitializer: 0.757924 second(s)
Elapsed time for arraySumOnHost: 0.062957 second(s)
Elapsed time for arraySumOnDevice <<< 16384, 1024 >>>: 0.001890 second(s)

Arrays are equal.
The --run flag runs the resulting executable (here, vecSum) after compilation. Now, we have a program executable
ready to be profiled
$ nsys profile --stats=true vecSum
The output of a nsys profile --stats=true <application> commands has three main sections: 1) the application output(s), if any; 2)
summary of processing reports along with their temporary storage destination folders; and 3) profiling statistics.
The first section is exactly the same as the program output given above. The second part of the profiler output yields processing details
about the .qdstrm, .qdrep, and .sqlite report files and their temporary storage folders.
Processing events...
Capturing symbol files...
Saving temporary "/tmp/nsys-report-2d75-dd10-9860-d729.qdstrm" file to disk...
Creating final output files...

Processing [==============================================================100%]
Saved report file to "/tmp/nsys-report-2d75-dd10-9860-d729.qdrep"
Exporting 1424 events: [==================================================100%]

Exported successfully to
/tmp/nsys-report-2d75-dd10-9860-d729.sqlite
The profiling statistics is the last part of our nsys profile --stats=true output, which consists of four separate
sections:
- CUDA API Statistics
- CUDA Kernel Statistics
- CUDA Memory Operations Statistics (in terms of time or size)
- Operating System Runtime API Statistics
Let us overview each section one by one and see what types of information is available to us for performance analysis without going though the details of each entry and analyzing the numbers.
2.1.1. CUDA API Statistics
CUDA API statistics report tables have seven columns, in which all timings are in nanoseconds (ns):
- Time (%): The percentage of the Total Time for all calls to the function listed in the Name column
- Total Time (ns): The total execution time of all calls to the function listed in the Name column
- Num Calls: The number of calls to the function listed in the Name column
- Average: The average execution time of the function listed in the Name column
- Minimum: The smallest execution time among the current set of function calls to the function listed in the Name column
- Maximum: The largest execution time among the current set of function calls to the function listed in the Name column
- Name: The name of the function being profiled
CUDA API Statistics:

 Time(%)  Total Time (ns)  Num Calls     Average      Minimum      Maximum            Name
 -------  ---------------  ---------  -------------  ----------  -----------  ---------------------
    87.2      415,182,743          3  138,394,247.7     519,539  414,129,668  cudaMalloc
    12.3       58,403,179          4   14,600,794.8  12,721,839   17,162,836  cudaMemcpy
     0.4        1,909,047          1    1,909,047.0   1,909,047    1,909,047  cudaDeviceSynchronize
     0.1          613,510          3      204,503.3     160,057      280,734  cudaFree
     0.0           41,222          1       41,222.0      41,222       41,222  cudaLaunchKernel
2.1.2. CUDA Kernel Statistics
CUDA Kernel statistics report summary has seven columns, in which all timings are in nanoseconds (ns):
- Time (%): The percentage of the Total Time for all kernel executions listed in the Name column
- Total Time (ns): The total execution time of all kernel launches listed in the Name column
- Instances: The number of kernel launches listed in the Name column
- Average: The average execution time of the kernel listed in the Name column
- Minimum: The smallest execution time among the current set of kernel launches listed in the Name column
- Maximum: The largest execution time among the current set of kernel launches listed in the Name column
- Name: The name of the GPU kernels being profiled
CUDA Kernel Statistics:

 Time(%)  Total Time (ns)  Instances    Average     Minimum    Maximum                       Name
 -------  ---------------  ---------  -----------  ---------  ---------  ---------------------------------------------
   100.0        1,781,674          1  1,781,674.0  1,781,674  1,781,674  arraySumOnDevice(float*, float*, float*, int)
2.1.3. CUDA Memory Operations Statistics
CUDA Memory Operations reports are tabulated by time (in ns) involving seven columns:
- Time (%): The percentage of the Total Time for all memory operations listed in the Operation column
- Total Time (ns): The total execution time of all memory operations listed in the Operation column
- Operations:The number of times the memory operations listed in the Operation column have been executed
- Average: The average memory size used for executing the Operation(s)
- Minimum: The smallest execution time among the current set of Operation(s)
- Maximum: The largest execution time among the current set of Operation(s)
- Operation: The name of the memory operation being profiled
CUDA Memory Operation Statistics (by time):

 Time(%)  Total Time (ns)  Operations    Average      Minimum     Maximum        Operation
 -------  ---------------  ----------  ------------  ----------  ----------  ------------------
    77.2       44,485,334           3  14,828,444.7  12,579,141  16,962,494  [CUDA memcpy HtoD]
    22.8       13,110,889           1  13,110,889.0  13,110,889  13,110,889  [CUDA memcpy DtoH]
or by size (in kB) consisting of six columns:
- Total: The total amount of GPU memory used for the memory operations listed in the Operation column
- Operations: The number of times the memory operations listed in the Operation column have been executed
- Average: The average execution time of the Operation(s)
- Minimum: The minimum amount of memory used among the current set of memory operations Operation(s) executed
- Maximum: The maximum amount of memory used among the current set of memory operations Operation(s) executed
- Operation: The name of the memory operation being profiled
CUDA Memory Operation Statistics (by size in KiB):

    Total     Operations   Average     Minimum     Maximum        Operation
 -----------  ----------  ----------  ----------  ----------  ------------------
  65,536.000           1  65,536.000  65,536.000  65,536.000  [CUDA memcpy DtoH]
 196,608.000           3  65,536.000  65,536.000  65,536.000  [CUDA memcpy HtoD]
2.1.4. Operating System Runtime API Statistics
The OS Runtime API report table has seven columns, in which all timings are in nanoseconds (ns):
- Time (%): The percentage of the Total Time for all calls to the function listed in the Name column
- Total Time (ns): The total execution time of all calls to the function listed in the Name column
- Num Calls: The number of calls to the function listed in the Name column
- Average: The average execution time of the function listed in the Name column
- Minimum: The smallest execution time among the current set of function calls to the function listed in the Name column
- Maximum: The largest execution time among the current set of function calls to the function listed in the Name column
- Name: The name of the function being profiled
Operating System Runtime API Statistics:

 Time(%)  Total Time (ns)  Num Calls    Average     Minimum    Maximum         Name
 -------  ---------------  ---------  ------------  -------  -----------  --------------
    85.5      501,135,238         16  31,320,952.4   19,438  100,185,161  poll
    13.5       78,934,009        674     117,112.8    1,191   11,830,047  ioctl
     0.5        2,810,648         87      32,306.3    1,724      838,818  mmap
     0.2          899,070         82      10,964.3    4,605       27,860  open64
     0.1          731,813         10      73,181.3   15,345      325,547  sem_timedwait
     0.1          412,876         28      14,745.6    1,414      272,205  fopen
     0.0          291,176          5      58,235.2   27,768      110,522  pthread_create
     0.0          196,169          3      65,389.7   62,525       67,914  fgets
     0.0           82,791          4      20,697.8    3,946       56,969  fgetc
     0.0           59,983         10       5,998.3    3,172       14,405  munmap
     0.0           52,364         22       2,380.2    1,201        8,422  fclose
     0.0           47,041         11       4,276.5    2,333        6,156  write
     0.0           36,940          6       6,156.7    4,222        8,393  fread
     0.0           30,565          5       6,113.0    4,716        7,174  open
     0.0           26,866         12       2,238.8    1,025        7,491  fcntl
     0.0           24,537         13       1,887.5    1,315        2,772  read
     0.0            9,755          2       4,877.5    3,702        6,053  socket
     0.0            7,798          1       7,798.0    7,798        7,798  connect
     0.0            7,306          1       7,306.0    7,306        7,306  pipe2
     0.0            2,033          1       2,033.0    2,033        2,033  bind
     0.0            1,315          1       1,315.0    1,315        1,315  listen
So far, we have demonstrated that the nsys CLI profiler provides a comprehensive report on statistics of CUDA Runtime APIs, GPU kernel executions, CUDA Memory Operations, and OS Runtime API calls. These reports provide useful information about the performance of the application and offer a great tool for adopting the APOD cycle for both analysis and performance optimization. In addition to the CLI profiler, NVIDIA offers profiling tools using GUIs. These are convenient ways to analyze profiling reports or compare performance results from different profiling runs on the same application. In the following sections, we overview the main aspects of the NVIDIA Nsight Systems’ GUI profiler.
2.2. Graphical User Interface Profiler
There are two main scenarios for working with Nsight Systems’ GUI framework:
- Generating the reports files (.qdrep) by the CLI profiler and import them into the Nsight Systems’ GUI profiler for further analysis
- Profiling the workload directly from the GUI
In the following subsections, we briefly overview each of these use cases.
2.2.1. Direct Performance Analysis using Nsight Systems’ GUI Profiler
Let’s fire up the Nsight Systems’ GUI profiler application by running the following command
$ nsys-ui
This should open up the application panel which looks like the figure below.
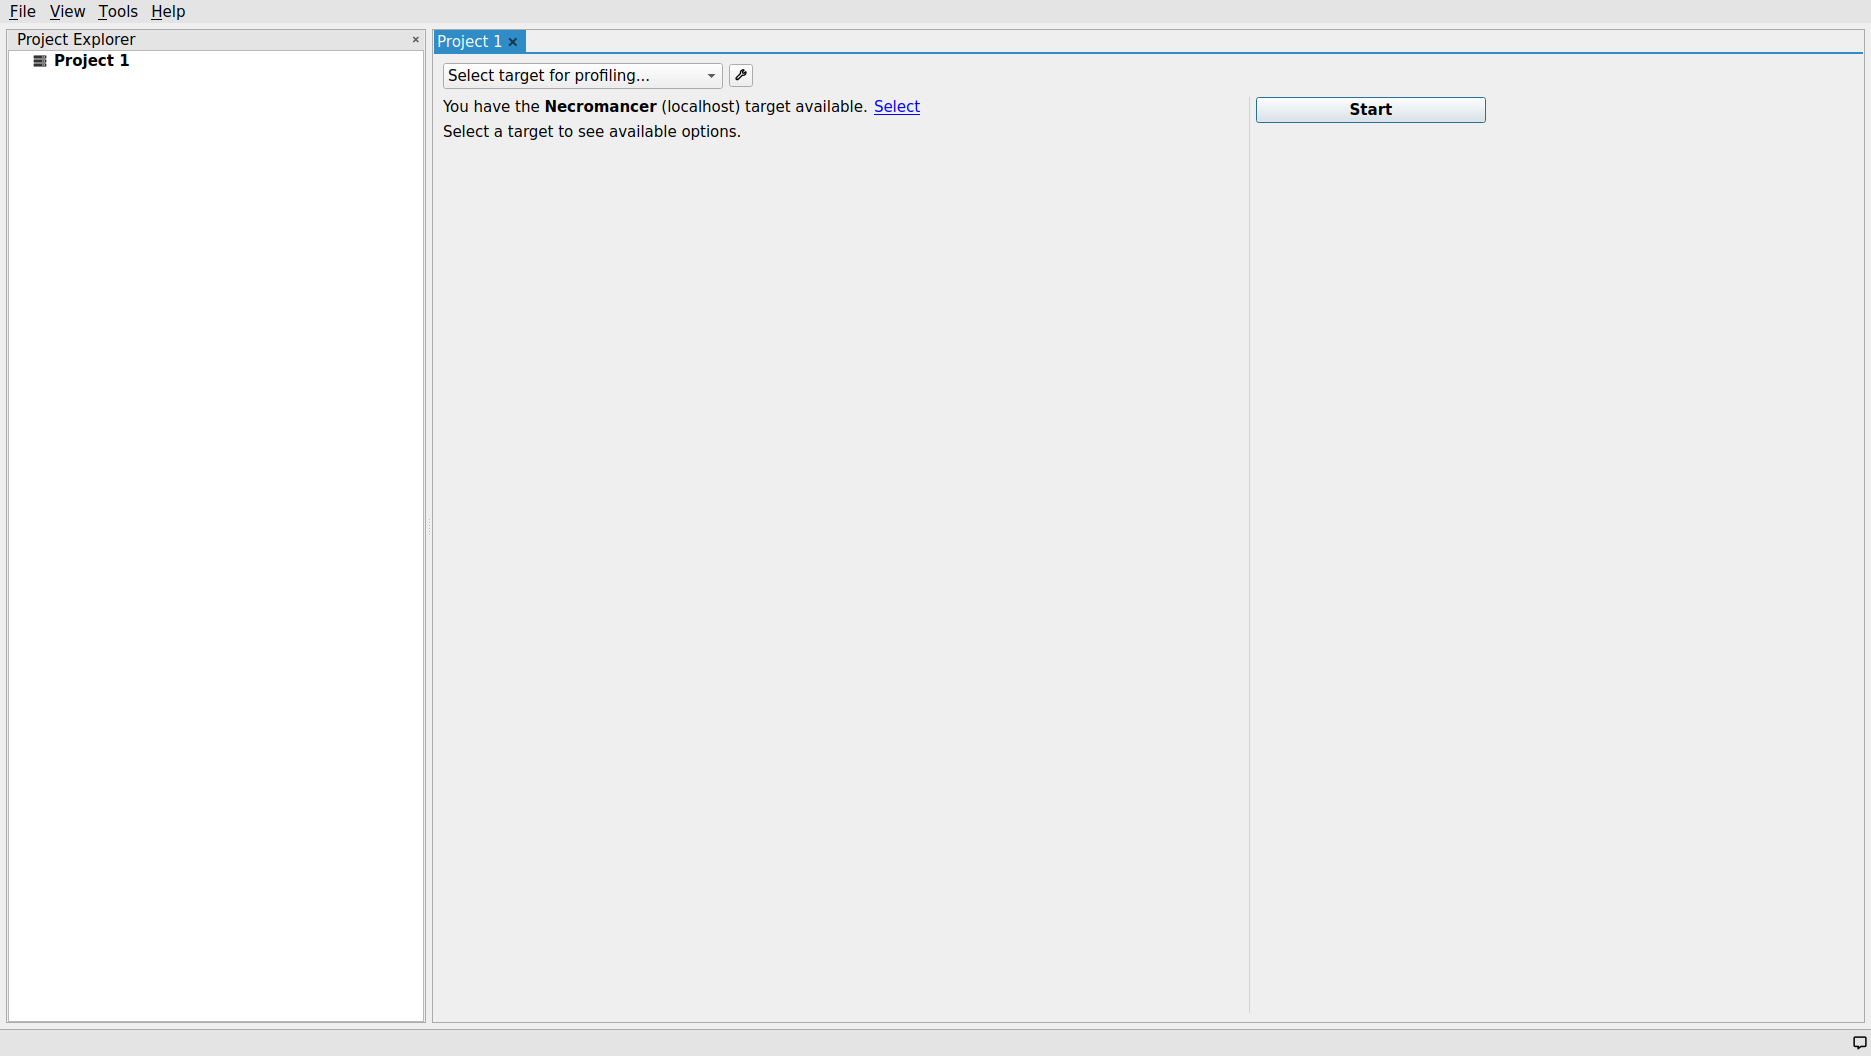
The Project Explorer panel on the left side of the screen will contain all projects (e.g., Project 1) and report files in a tree structure. The Nsight System makes it possible to compare two or multiple profiling report files and/or projects within the same environment and side-by-side fashion.
Note:
On a Linux OS, all project folders are physically stored in ~/.nsightsystems/Projects/.
At this stage, the host machine for performing the profiling process should be specified. In this case, Nsight System’s GUI profiler has already
identified the localhost as an available profiling target and notified us with a message: “You have the
As soon as the target machine is selected, a rather large list of checkboxes show up that allows the users to customize their profiling process and specify which type of information should be collected and reported as a result of profiling process. As shown in the figure below, similar to the CLI profiler command, it is mandatory to specify the working directory and the target application executable to be profiled. The aforementioned parameters can be specified in their corresponding entries within the Sample target process/Target application drop-down menu combobox.
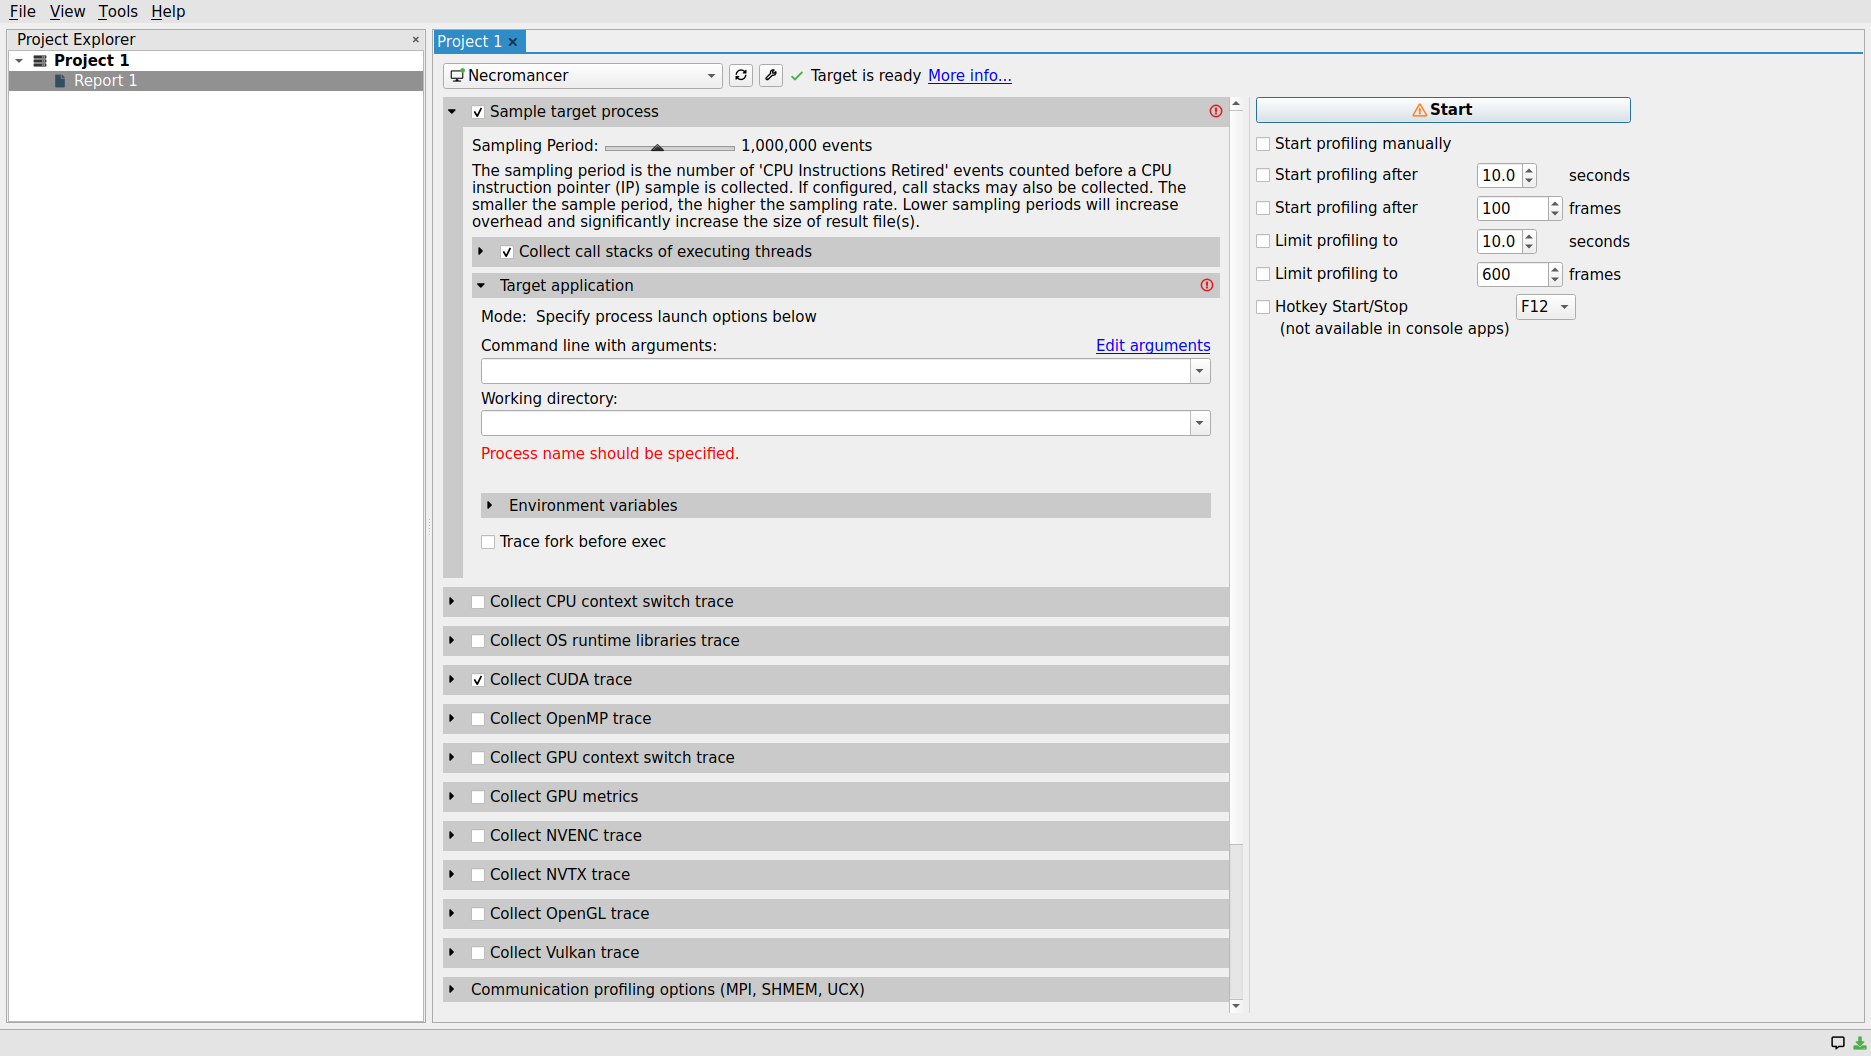
Let us press the start button to begin profiling the program. After finishing the profiling process, the results will be shown in a new window as illustrated below.
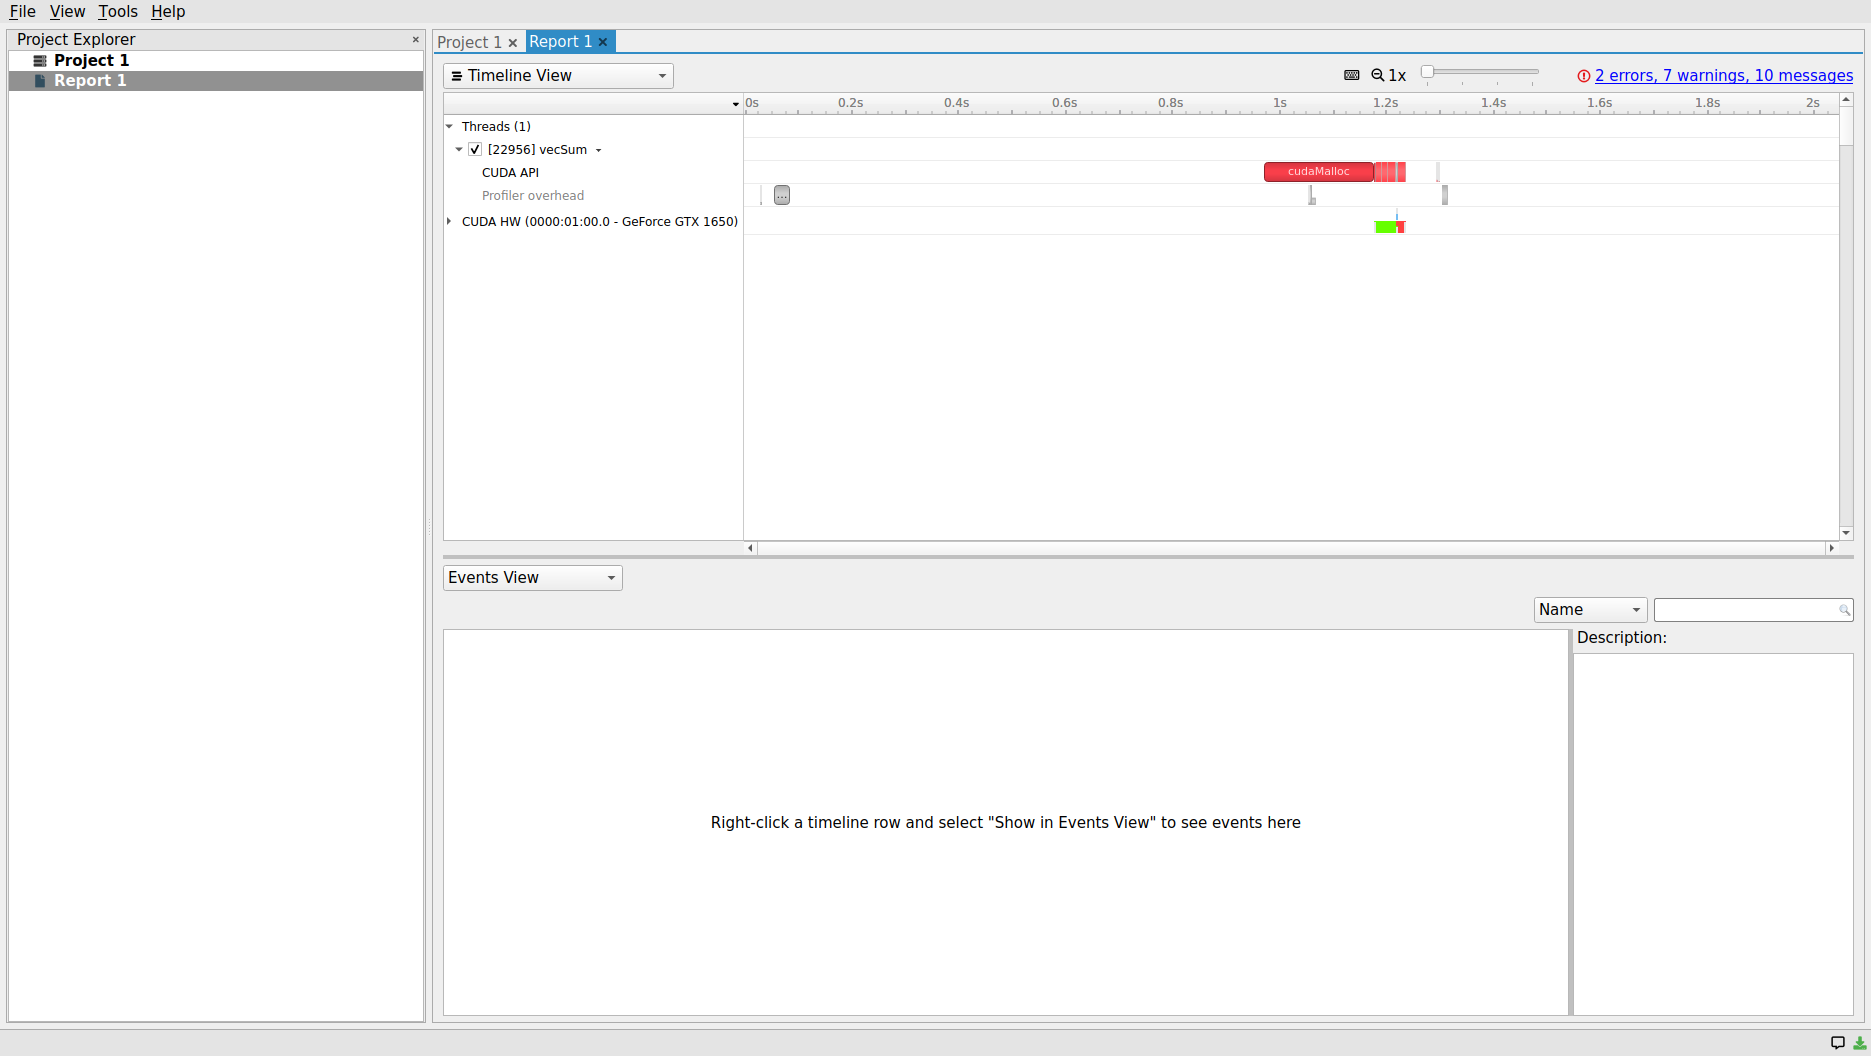
Project Explorer panel shows that the generated report file (Report 1.qdrep) is now part of Project 1. Therefore, we should be able to find the report file in the ~/.nsightsystems/Projects/Project 1/, by default. In setting up our profiling preferences, we chose to collect only CUDA API, memory and kernel operations during the execution of the program by the profiler to simplify the analysis. As such, only two timeline channels are available for our inspection within the Timeline View of the main central panel: (i) Threads, and (ii) CUDA Hardware (HW). The numbers following the CUDA HW refer to BUS location (here, 0000:01:00.0) and the GPU device name/model (in this case, GeForce GTX 1650).
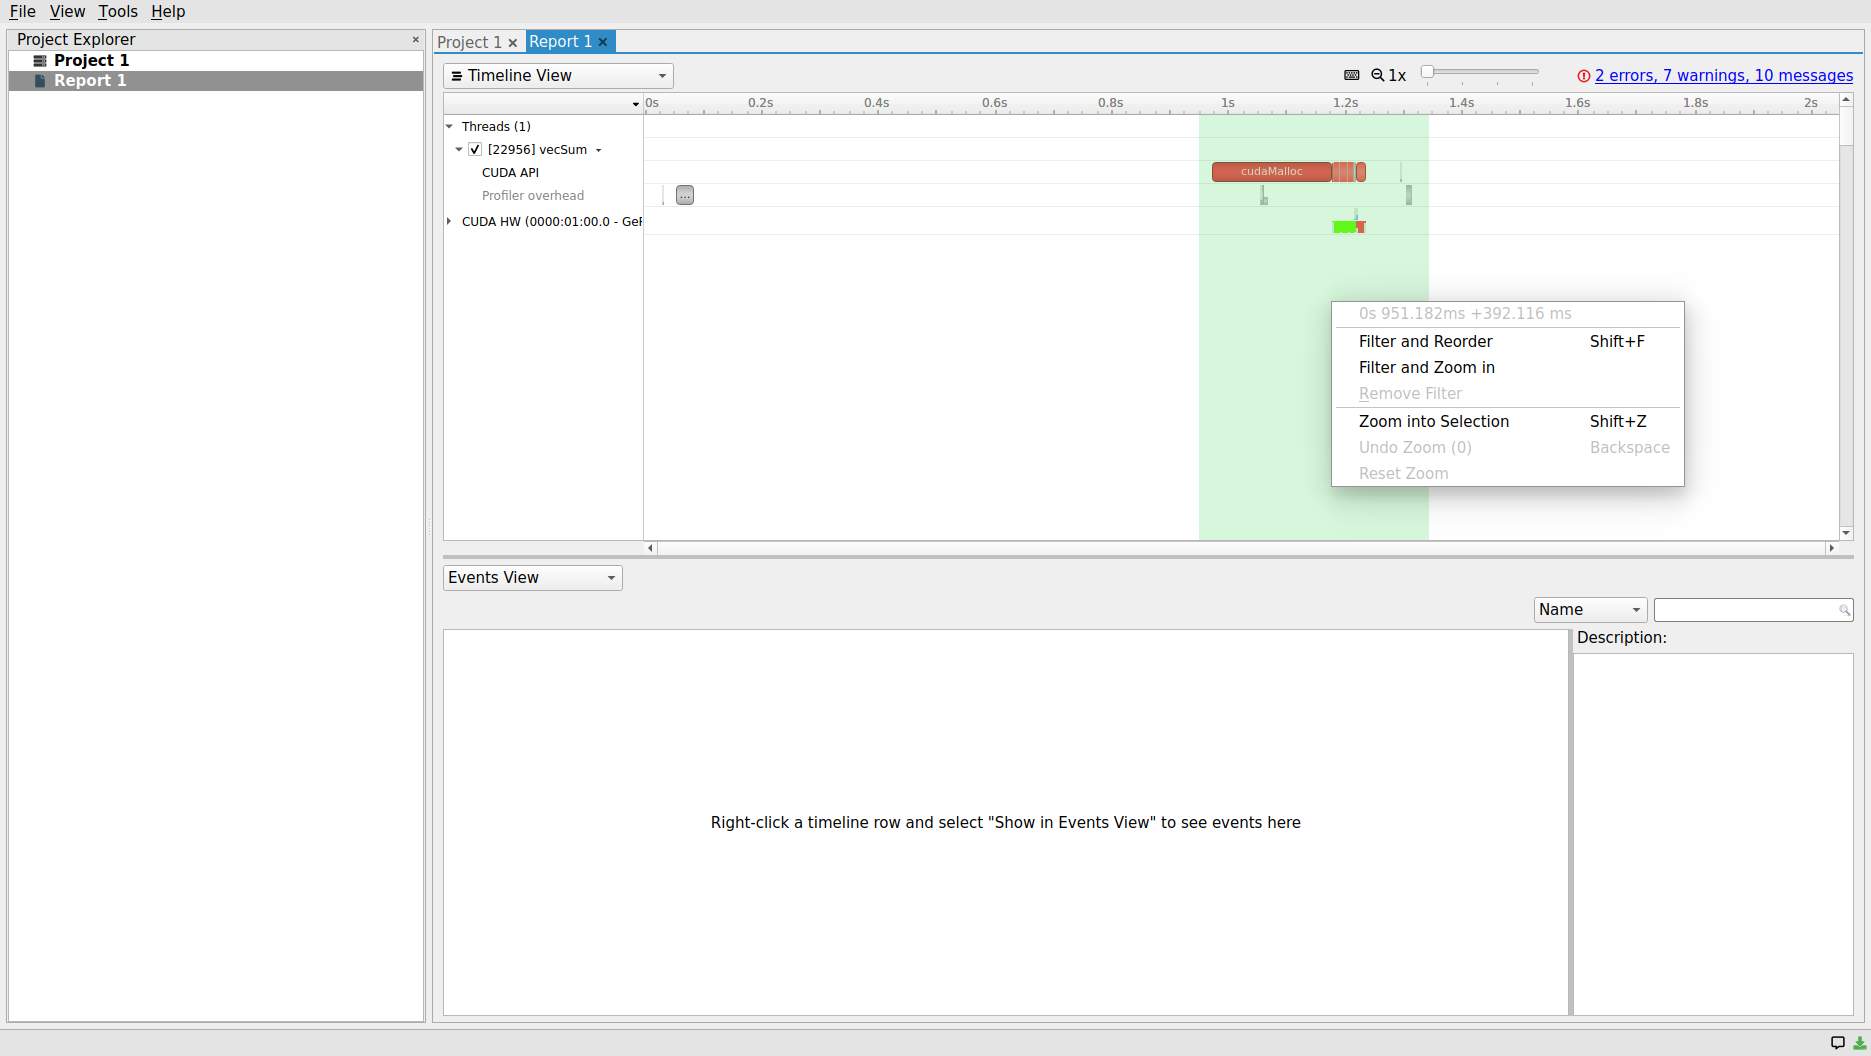
The default zoom level as well as the sizing of each panel section might not be ideal for a convenient analysis. The zoom level can easily be modified by either using the horizontal slide button at the top of the Timeline View panel, or using the ctrl + mouse scroll button. Alternatively, the area of interest in the timeline panel can be highlighted by selecting the starting time through a mouse left-click and dragging it to the final selected point in time and releasing the mouse button. Then, right-click on the selected area and select the Filter and Zoom in or Zoom into Selection from the menu. The right-click menu also provides an incremental or reset-to-default option as well for reversing the aforementioned operations.
The GUI offers an even more convenient and productive way of inspecting the timelines. The message at the center of the Events View panel at the bottom of the screen says: “Right-click a time-line row and select “Show in Events View” to see events here”. Let’s slide the zoom button at the top of the scree to widen the timelines a little and then, follow the aforementioned instructions in the message. The resulting screen should look like the following screenshot
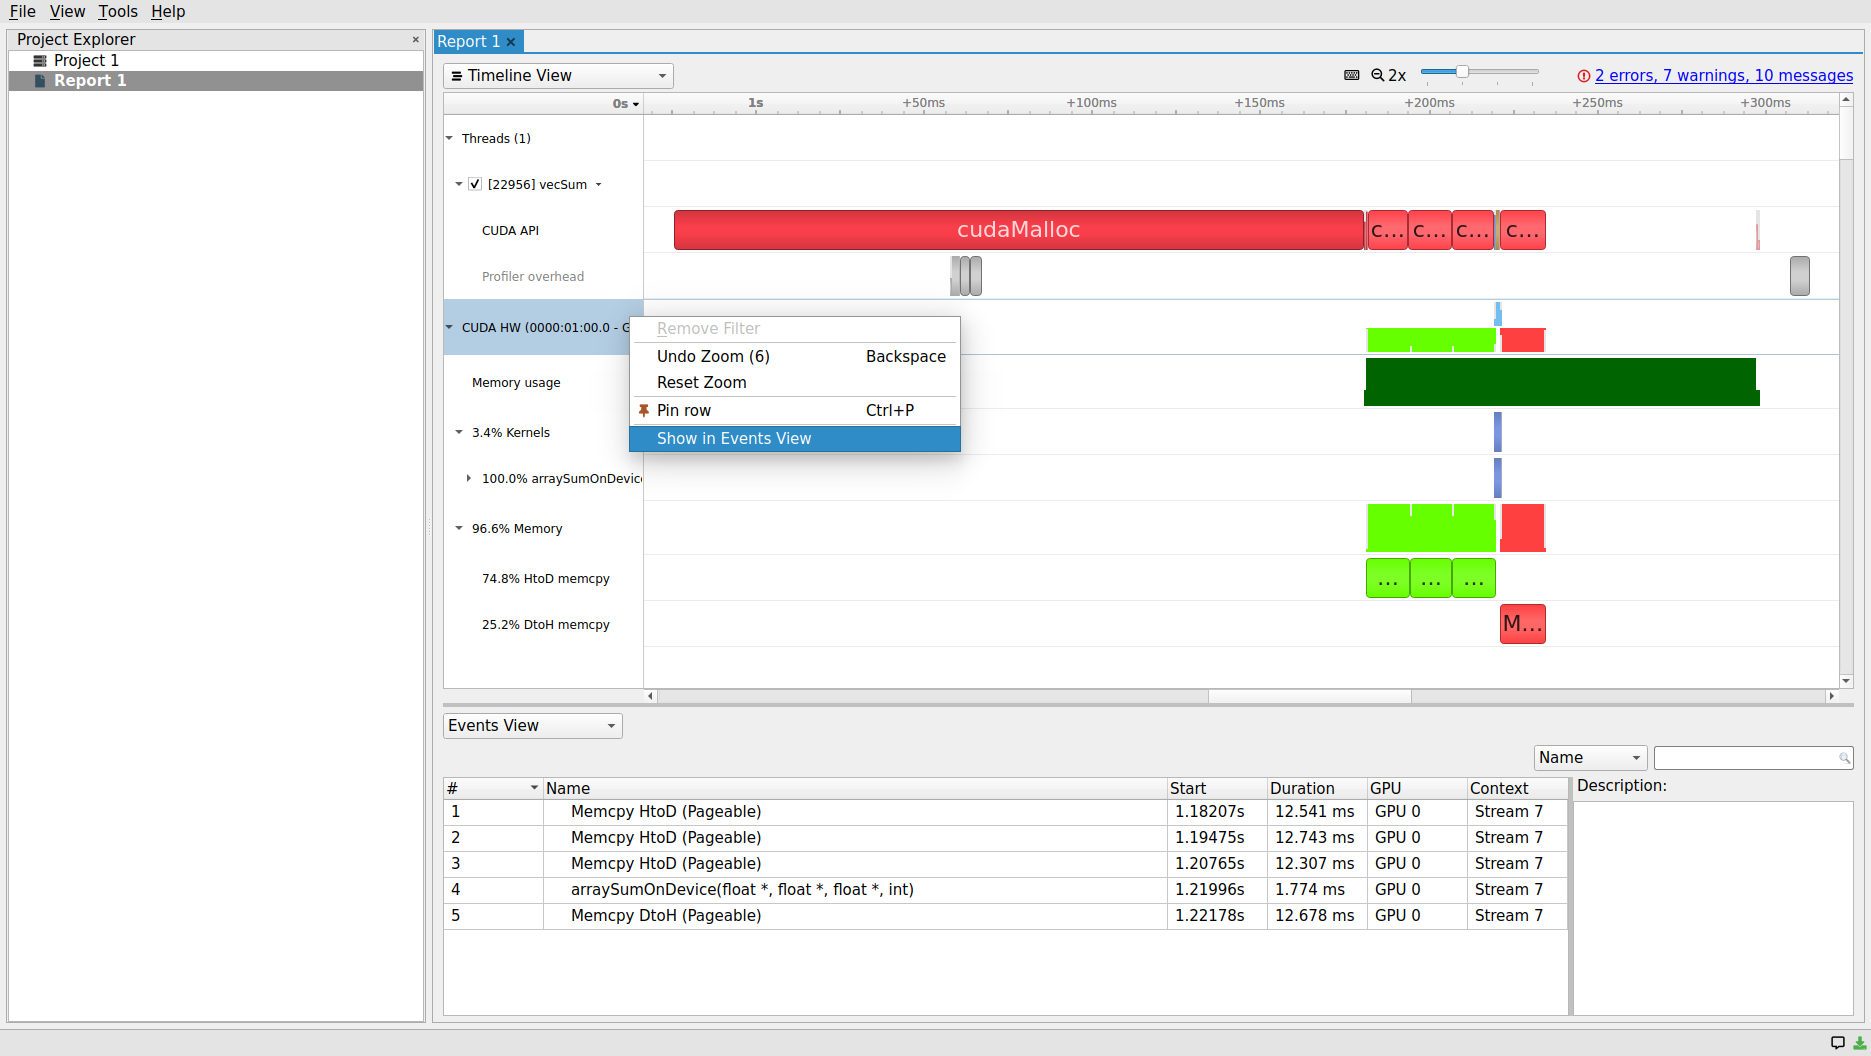
Since we have right-clicked on the CUDA HW, which includes both Memory and Kernels sub-timelines, both CUDA memory and kernel operation statistics are included in the report table within the Events View panel. Clicking on each row, which corresponds to an operation on the device, will populate the right-bottom corner Description panel. The populated panel provides a summary that corresponds to the selected row in the Event View. The exact same description can also be obtained through hovering on each block within each CUDA HW timeline as shown below.
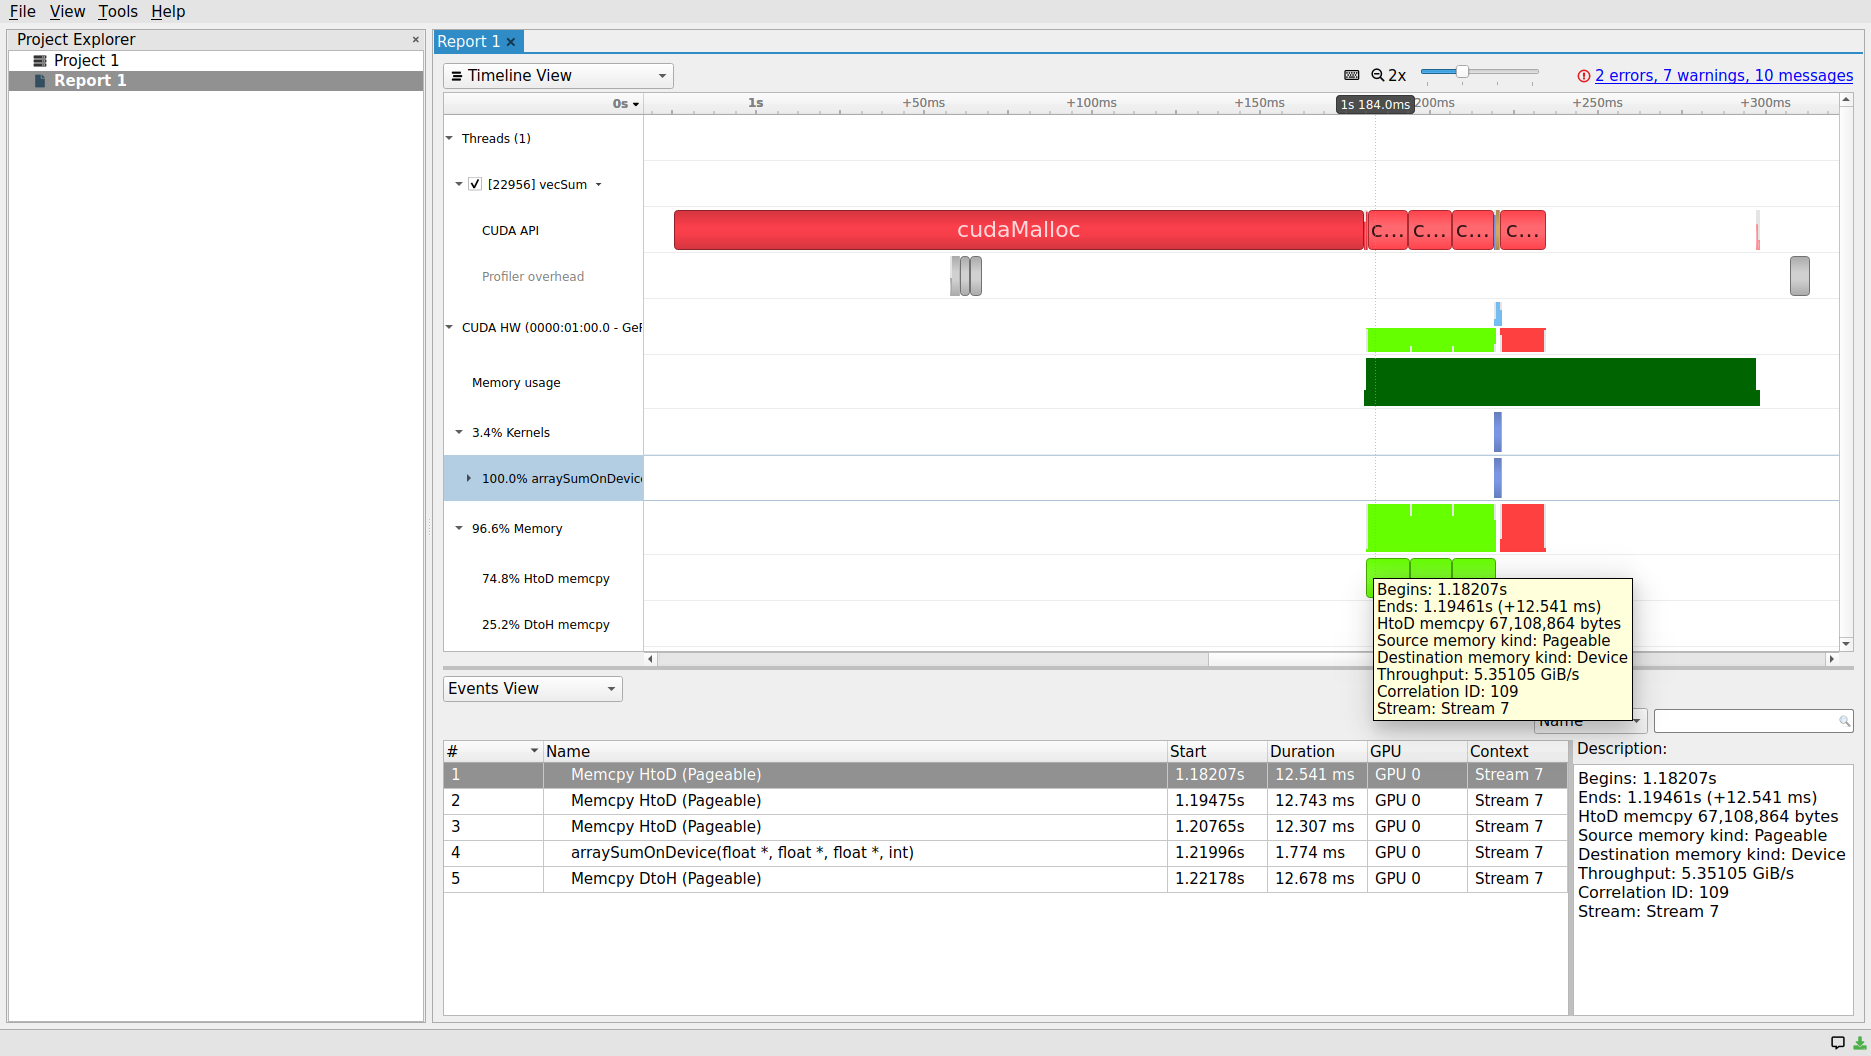
Using either Timeline View or Event View panels, one can describe the main parts of the vector sum example CUDA application: there are three HtoD data transfers to the d_a, d_b and
d_c arrays, allocated on the device, (arraySumOnDevice) kernel launch, and transferring the results back form DtoH.
2.2.2. Importing Report Files in Nsight Systems’ GUI Profiler
The Nsight System GUI profiler can be also employed to import the report files generated by the CLI profiler or the GUI profiler itself, as shown in the previous subsection. The report file can be easily opened from the File/Open menu. Since our description of the profiler in the previous subsection also remains valid for the present subsection, we will not repeat anything further.
Note:
Experienced users who used to work with NVIDIA Visual Profiler (nvvp) and NVIDIA profiler (nvprof) will probably notice a lot of similarities between their user interface with those of Nsight Systems. Both nvvp and nvprof will be deprecated in future CUDA releases and will not be supported by new GPUs with compute capability 8.0 and higher. For more details, see NVIDIA developers’ blog posts on Migrating to NVIDIA Nsight Tools from NVVP and Nvprof and Transitioning to Nsight Systems from NVIDIA Visual Profiler/nvprof.
3. NVIDIA Nsight Compute
Nsight Compute is a highly efficient interactive kernel profiler, which similar to NVIDIA Nsight Systems, provides both CLI and GUI. Nsight Compute offers a comprehensive list of performance metrics, API debugging tools, and the possibility of comparing profiling reports all at the same place. The list of available metrics is huge and can be queried using
$ ncu --query-metrics
which generates the following output (only the first few lines are shown)
Device TU117
------------------------------------------------------- ----------------------------------------------------------------------------
Metric Name                                             Metric Description
------------------------------------------------------- ----------------------------------------------------------------------------
dram__bytes                                             # of bytes accessed in DRAM
dram__bytes_read                                        # of bytes read from DRAM
dram__bytes_write                                       # of bytes written to DRAM
dram__cycles_active                                     # of cycles where DRAM was active
dram__cycles_active_read                                # of cycles where DRAM was active for reads
dram__cycles_active_write                               # of cycles where DRAM was active for writes
dram__cycles_elapsed                                    # of elapsed DRAM memory clock cycles
dram__cycles_in_frame                                   # of cycles in user-defined frame
dram__cycles_in_region                                  # of cycles in user-defined region
dram__sectors                                           # of sectors accessed in DRAM
dram__sectors_read                                      # of sectors read from DRAM
dram__sectors_write                                     # of sectors written to DRAM
dram__throughput                                        DRAM throughput
...
At this point, instead of printing the output to the console, it might be easier to store them in a text file by appending the aforementioned
command with >> <outputFileName>.txt. Once we explain the metrics’ naming conventions, such queries can be performed much more efficiently,
based on the logical units involved with the measured metrics. For example, we can narrow down our search only to those metrics pertinent to
device’s main dynamic random access memory (DRAM) and denoted by the prefix dram as
$ ncu --query-metrics | grep dram__
The resulting output is similar to the one shown above without the remaining parts of it.
3.1. Command Line Interface Profiler
Having a long list of available metrics can be very helpful as it allows choosing from a fine-tuned variety of options to analyze the performance of a parallel application. However, for an inexperienced user, making the right choice of metric(s) for performance analysis can be overwhelming. NVIDIA deals with this problem by using pre-defined sets and sections of logically associated metrics. The current list of available sections can be queried via
$ ncu --list-sections
which yields
--------------------------------- ------------------------------------- ------- --------------------------------------------------
Identifier                        Display Name                          Enabled Filename
--------------------------------- ------------------------------------- ------- --------------------------------------------------
ComputeWorkloadAnalysis           Compute Workload Analysis             no      ...20.3.0/Sections/ComputeWorkloadAnalysis.section
InstructionStats                  Instruction Statistics                no      ...2020.3.0/Sections/InstructionStatistics.section
LaunchStats                       Launch Statistics                     yes     ...pute/2020.3.0/Sections/LaunchStatistics.section
MemoryWorkloadAnalysis            Memory Workload Analysis              no      ...020.3.0/Sections/MemoryWorkloadAnalysis.section
MemoryWorkloadAnalysis_Chart      Memory Workload Analysis Chart        no      ...0/Sections/MemoryWorkloadAnalysis_Chart.section
MemoryWorkloadAnalysis_Deprecated (Deprecated) Memory Workload Analysis no      ...tions/MemoryWorkloadAnalysis_Deprecated.section
MemoryWorkloadAnalysis_Tables     Memory Workload Analysis Tables       no      .../Sections/MemoryWorkloadAnalysis_Tables.section
Nvlink                            NVLink                                no      ...Nsight Compute/2020.3.0/Sections/Nvlink.section
Occupancy                         Occupancy                             yes     ...ght Compute/2020.3.0/Sections/Occupancy.section
SchedulerStats                    Scheduler Statistics                  no      ...e/2020.3.0/Sections/SchedulerStatistics.section
SourceCounters                    Source Counters                       no      ...ompute/2020.3.0/Sections/SourceCounters.section
SpeedOfLight                      GPU Speed Of Light                    yes     ... Compute/2020.3.0/Sections/SpeedOfLight.section
SpeedOfLight_RooflineChart        GPU Speed Of Light Roofline Chart     no      ...3.0/Sections/SpeedOfLight_RooflineChart.section
WarpStateStats                    Warp State Statistics                 no      ...e/2020.3.0/Sections/WarpStateStatistics.section
Each section is composed of sets of metrics allowing users to choose between faster but less detailed profiles and slower but more comprehensive metric collections. Available sets can be listed via
$ ncu --list-sets
which gives
Identifier Sections                                                                    Enabled Estimated Metrics
---------- --------------------------------------------------------------------------- ------- -----------------
default    LaunchStats, Occupancy, SpeedOfLight                                        yes     36
detailed   ComputeWorkloadAnalysis, InstructionStats, LaunchStats, MemoryWorkloadAnaly no      173
           sis, Nvlink, Occupancy, SchedulerStats, SourceCounters, SpeedOfLight, Speed
           OfLight_RooflineChart, WarpStateStats
full       ComputeWorkloadAnalysis, InstructionStats, LaunchStats, MemoryWorkloadAnaly no      178
           sis, MemoryWorkloadAnalysis_Chart, MemoryWorkloadAnalysis_Tables, Nvlink, O
           ccupancy, SchedulerStats, SourceCounters, SpeedOfLight, SpeedOfLight_Roofli
           neChart, WarpStateStats
source     SourceCounters                                                              no      56
The the first row in the available sets (or the third column in the available sections) table shown above indicates that the metrics that
Nsight Compute CLI profiler collects by default include high-level GPU utilization, occupancy and static launch data. The latter two do not
require kernel launch replay. The latter two are regularly available without replaying the kernel launch. When no options such as --set, --section and no --metrics are provided to the CLI profiler,
the Nsight Compute will only collect the default set of metrics. Although the full set of sections can be collected using --set full option,
it is important to keep in mind that the number and type of the selected metrics directly affects the profiling overhead and performance.
Let us once again, run the CLI profiler on the vector sum example in order to collect the default set of metrics for the arraySumOnDevice kernel.
$ ncu -o output vecSum
This command exports the profiling results to the output.ncu-rep file. In the absence of the option and the output filename, the results will be
printed on the console screen and stored in temporary files which will be deleted after finishing the execution. Apart from the results of the
application print statements as well as profiler logs (denited by ==PROF==),
Kicking off /home/sina/MOLSSI/gpu_programming_beginner/src/gpu_vector_sum/v2_cudaCode/vecSum

==PROF== Connected to process 18985 (/home/sina/MOLSSI/gpu_programming_beginner/src/gpu_vector_sum/v2_cudaCode/vecSum)
GPU device GeForce GTX 1650 with index (0) is set!

Vector size: 16777216 floats (64 MB)

Elapsed time for dataInitializer: 0.765827 second(s)
Elapsed time for arraySumOnHost: 0.064471 second(s)
==PROF== Profiling "arraySumOnDevice" - 1: 0%....50%....100% - 8 passes
Elapsed time for arraySumOnDevice <<< 16384, 1024 >>>: 0.570959 second(s)

Arrays are equal.

==PROF== Disconnected from process 18985
[18985] vecSum@127.0.0.1
  arraySumOnDevice(float*, float*, float*, int), 2021-Oct-05 13:48:45, Context 1, Stream 7
the resulting profiler output consist of three main sections: (i) GPU Speed of Light, (ii) kernel launch statistics, and (iii) Occupancy.
3.1.1. GPU Speed of Light
GPU Speed of Light section offers a high-level summary of device’s memory resource and compute throughput in terms of achieved utilization percentage with respect to the maximum theoretical limit of the metric being measured. The following table shows the GPU Speed of Light section of the default metric collection output for the Nsight Compute CLI profiler
    Section: GPU Speed Of Light
    ---------------------------------------------------------------------- --------------- ------------------------------
    DRAM Frequency                                                           cycle/nsecond                           4.00
    SM Frequency                                                             cycle/nsecond                           1.41
    Elapsed Cycles                                                                   cycle                      2,499,985
    Memory [%]                                                                           %                          89.44
    SOL DRAM                                                                             %                          89.44
    Duration                                                                       msecond                           1.77
    SOL L1/TEX Cache                                                                     %                          13.15
    SOL L2 Cache                                                                         %                          33.45
    SM Active Cycles                                                                 cycle                   2,269,457.25
    SM [%]                                                                               %                          10.49
    ---------------------------------------------------------------------- --------------- ------------------------------
    OK    The kernel is utilizing greater than 80.0% of the available compute or memory performance of the device. To
          further improve performance, work will likely need to be shifted from the most utilized to another unit.
          Start by analyzing workloads in the Memory Workload Analysis section.
Note that Nsight Compute profiler notifies the user about the arraySumOnDevice kernel with the adopted execution configuration
which achieved more than 80% of the theoretical limits for the memory/compute throughput. The profiler also provides additional
recommendation(s) for further performance improvement. We will talk about strategies recommended by the profiler in the upcoming
lessons.
3.1.2. Launch Statistics
The Launch Statistics section offers the details of the adopted execution configuration in the launched kernel being profiled such as number of threads in blocks, total number of threads, total number of blocks etc..
    Section: Launch Statistics
    ---------------------------------------------------------------------- --------------- ------------------------------
    Block Size                                                                                                      1,024
    Function Cache Configuration                                                                  cudaFuncCachePreferNone
    Grid Size                                                                                                      16,384
    Registers Per Thread                                                   register/thread                             16
    Shared Memory Configuration Size                                                 Kbyte                          32.77
    Driver Shared Memory Per Block                                              byte/block                              0
    Dynamic Shared Memory Per Block                                             byte/block                              0
    Static Shared Memory Per Block                                              byte/block                              0
    Threads                                                                         thread                     16,777,216
    Waves Per SM                                                                                                    1,024
    ---------------------------------------------------------------------- --------------- ------------------------------
3.1.3. Occupancy
The multiprocessor occupancy is defined as the ration of active warps to the maximum number of warps supported on the multiprocessor of the GPU. Alternatively, occupancy can be defined as device’s ability to process warps that is actively in use.
One way to calculate the multiprocessor occupancy is by using the CUDA Occupancy Calculator which is a .xls spreadsheet file with pre-defined macros. The user populates the required fields in the spreadsheet and it calculates and returns the multiprocessor occupancy. Another way to calculate the multiprocessor occupancy is to use Nsight Compute kernel profiler. The occupancy metric is automatically collected and tabulated in the Occupancy section in the output of the Nsight Compute CLI profiler as follows
    Section: Occupancy
    ---------------------------------------------------------------------- --------------- ------------------------------
    Block Limit SM                                                                   block                             16
    Block Limit Registers                                                            block                              4
    Block Limit Shared Mem                                                           block                             16
    Block Limit Warps                                                                block                              1
    Theoretical Active Warps per SM                                                   warp                             32
    Theoretical Occupancy                                                                %                            100
    Achieved Occupancy                                                                   %                          90.37
    Achieved Active Warps Per SM                                                      warp                          28.92
    ---------------------------------------------------------------------- --------------- ------------------------------
This table illustrates that the arraySumOnDevice kernel in the vector sum example activates more than 90% of the available warps on each streaming multiprocessor (SM) or equivalently,
activates more than 90% of the available warps per SM.
Note:
Higher values of occupancy does not always translate to higher performance. However, low occupancy always indicates GPU’s reduced ability to hide latencies and thus, performance degradation. Note that large gaps between achieved and theoretical occupancy during kernel execution implies an imbalance workload.
3.2. Graphical User Interface Profiler
Similar to its Nsight Systems counterpart, Nsight Compute GUI also provides two main scenarios for the performance analysis of the CUDA kernel(s):
- Generating the reports files (.ncu-rep) by the CLI profiler and import them into the Nsight Compute’s GUI for further analysis
- Profiling the workload directly from the GUI
In the following subsections, we briefly overview each of these use cases.
3.2.1. Direct Performance Analysis using Nsight Compute’s GUI Profiler
Let us start the Nsight Compute’s GUI profiler application by running the following command
$ ncu-ui
This will open up the main application window and an embedded Welcome Page window which looks like the figure below. This window gives you multiple options to start your performance analysis either by opening/creating a project file or use the last session’s settings to get straight to the profiling settings without an existing project.
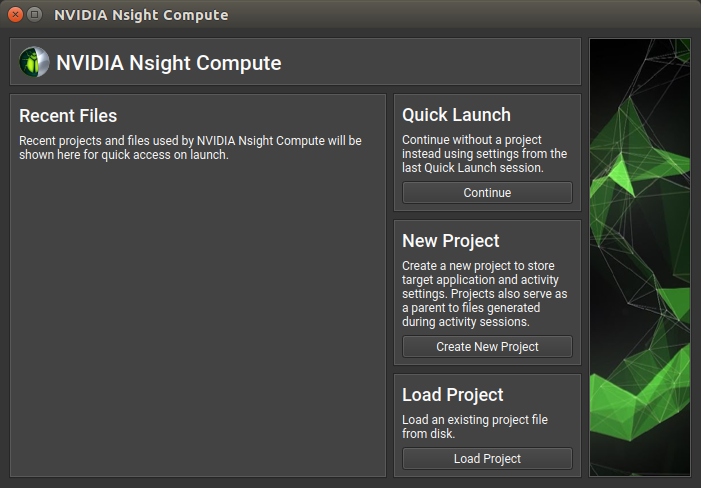
Clicking on the Continue button under Quick Launch gets us to the Connect to process connection dialog as shown below
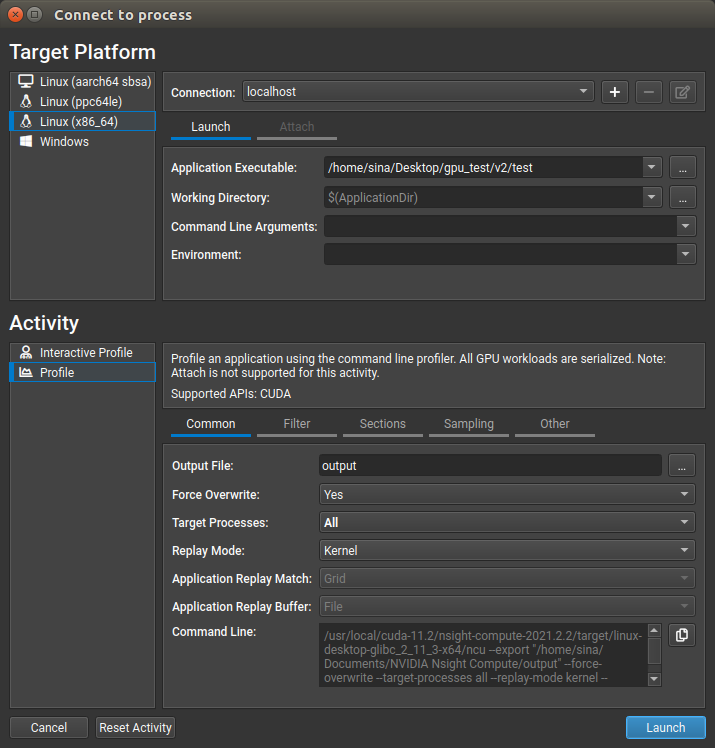
The Connect to process window has to panels: (i) Target Platform, and (ii) Activity. The Target Platform panel’s interface is very similar to what we saw in Section 2.2.1. Direct Performance Analysis using Nsight Systems’ GUI Profiler for Nsight System - The user needs to specify the target platform and the local/remote hosting machine on which the profiling process is going to be performed. The absolute address to the parallel application’s executable file must be specified in the Application Executable field. Any additional options to the executable can be passed to the executable via the Command Line Arguments field.
The Activity panel offers two distinct profiling modes:
The Interactive Profile mode allows users to interactively control the target application execution, and isolate and profile the kernels of interest in a step-by-step fashion. For the purpose of this tutorial, we will not get into the details of Interactive Profile Activity.
After selecting the (non-interactive) Profile mode from the Activity panel, fill in the name and absolute address of the output report file in the
Output File field within the Common tab. This maps to specifying the output file name using the --export or -o CLI options. The provided name
will be appended by thencu-rep suffix. The Target Processes field specifies the process that is going to be profiled: (i) Application Only,
which only profiles the application itself, and (ii) All, which tells the Nsight Compute to profile the target application and all its child processes.
Setting the options for the Target Process field maps to specifying the --target-processes CLI option. In the Replay Mode field, the user can choose between Kernel or Application options. In the Kernel mode,
individual kernel launches are replayed for metric collections within the course of a single execution of the target application. However, in the
Application mode, the target application itself will be replayed for multiple times which allows the collection of additional data for kernel launches.
Setting the Replay Mode option is equivalent to specifying the --replay-mode CLI option. The remaining fields also map to their
CLI profiler counterpart options. The entire profiling
operation command with specified options is automatically generated and can be copied from the Command Line text box.
The Filter tab allows users to select the target kernels to be profiled and includes kernel regex filer, the number of kernel launches to be skipped, and the total number of kernel executions to be profiled. The Sections tab allows the specification of metric section(s) to be collected for each kernel launch. Hovering over each section provides its description in a pop-up tooltip.
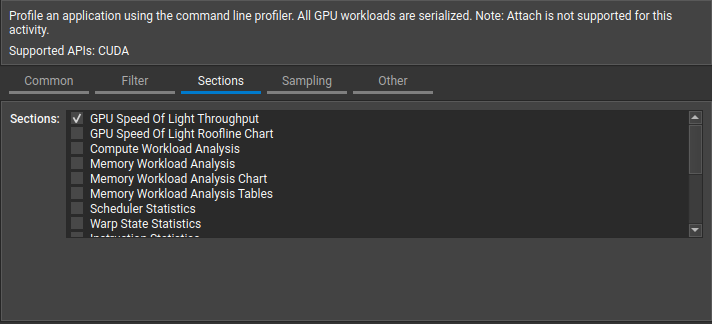
The Sampling tab allows the modification of sampling options for each kernel execution. The Other tab offers options for the application of rules, controlling the profiling process, custom metrics and options for collecting NVIDIA Tools Extension (NVTX) information. It is time to press the launch button at the bottom-right corner of the to fire up the profiling process.
After the Nsight Compute finishes the profiling process, the resulting report file shows up under the corresponding project file in the Project Explorer panel. The Nsight Compute profiler report file contains multiple report pages:
The aforementioned report pages can be accessed from the Page dropdown button at the top of the report panel. The Session page provides preliminary
information about the hosting machine, active process ID(s) to be profiled and device attributes. Switching between various launch instances highlights the
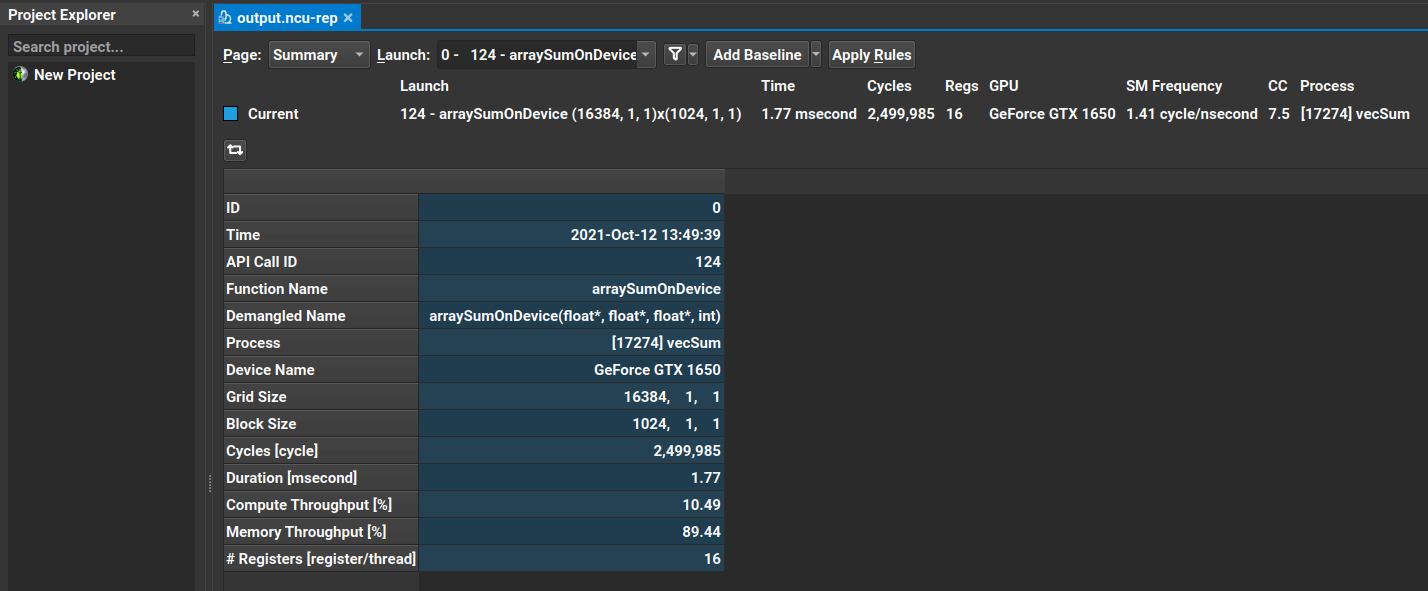
corresponding device attributes. The Summary page overviews a list of collected results across all kernel executions. A screenshot of the Summary page
from profiling the arraySumOnDevice kernel in the vector sum example is provided below
The Details page is where the Nsight Compute’s GUI profiler automatically lands on by default, once the profiling process is finished.
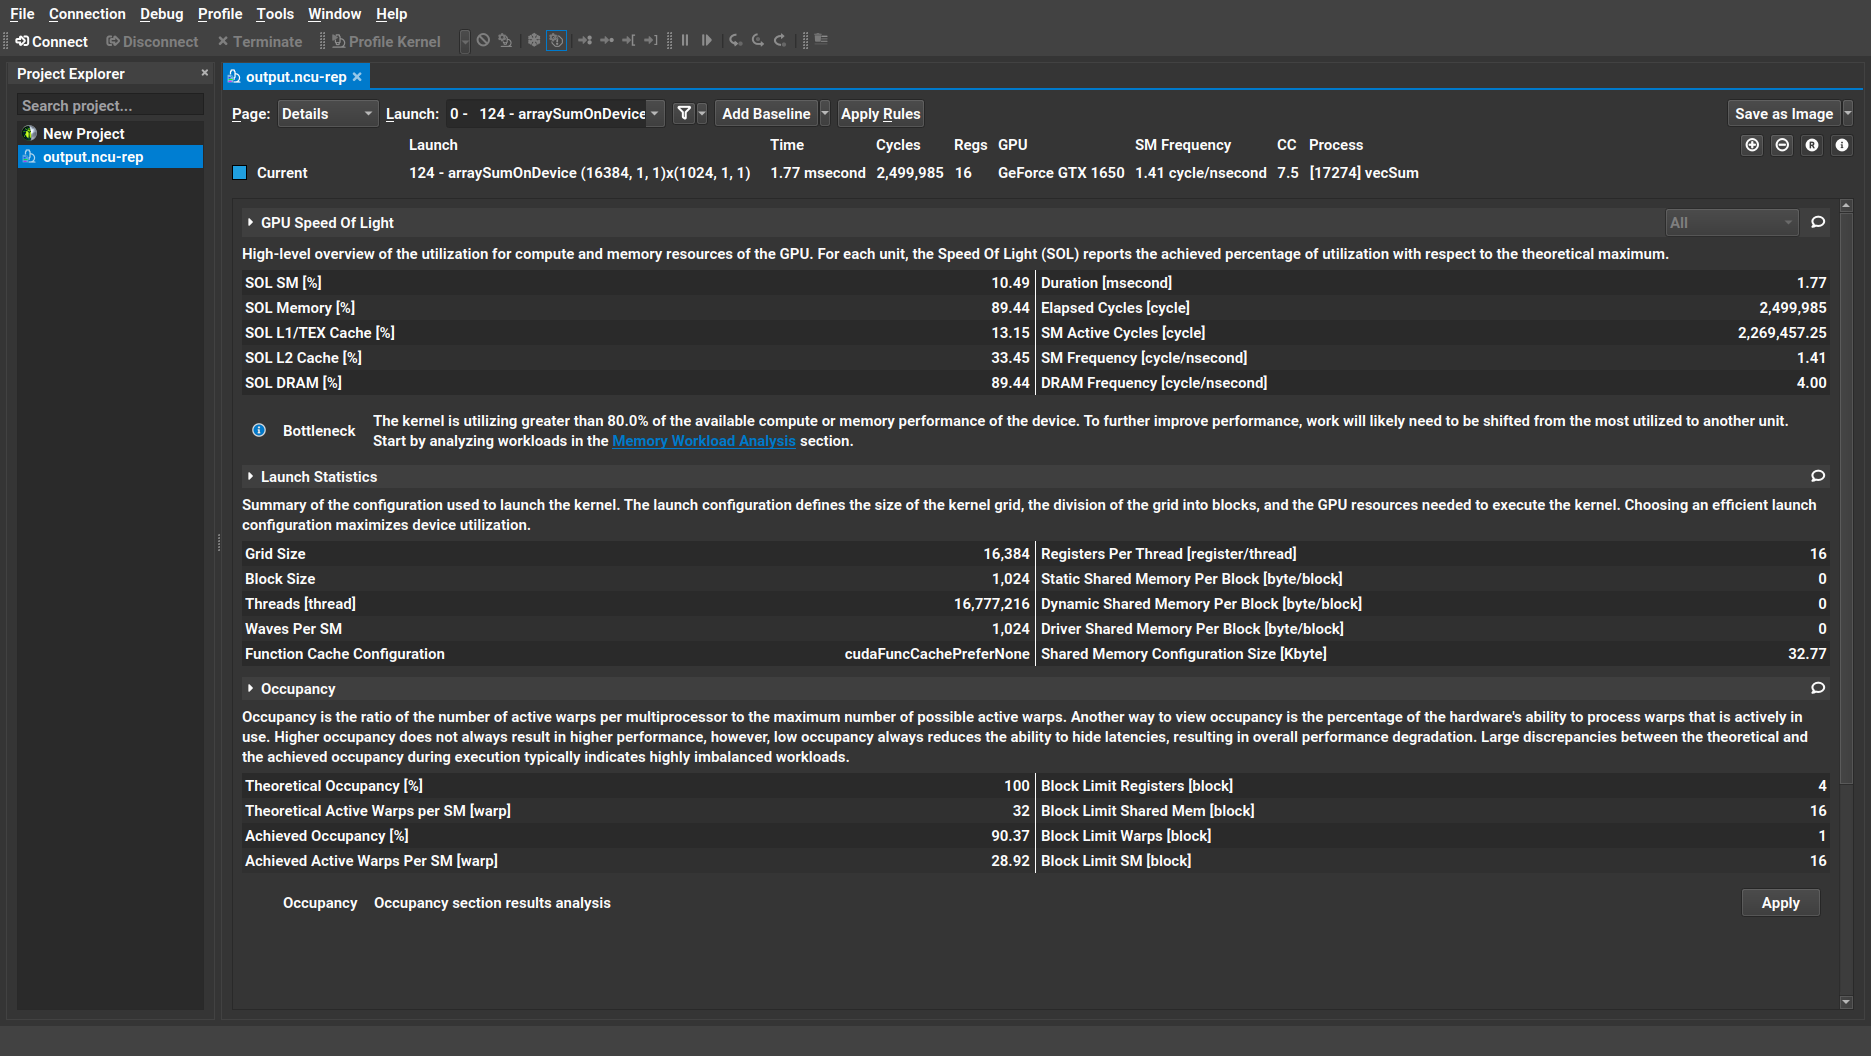
Similar to the output of the ncu CLI profiler we saw in Section 3.1. Command Line Interface Profiler, there are three metric sections that the profiler collected by default: GPU Speed of Light, kernel Launch Statistics and multiprocessor Occupancy. The header in each section provides a brief description of the metrics being measured within that section.
In comparison with the Nsight Compute CLI profiler, GUI also provides one or more body subsections within the Speed of Light section: SOL breakdown and SOL chart for GPU compute/memory utilization. These additional information can be accessed by clicking on the GPU Speed of Light section’s dropdown arrow button
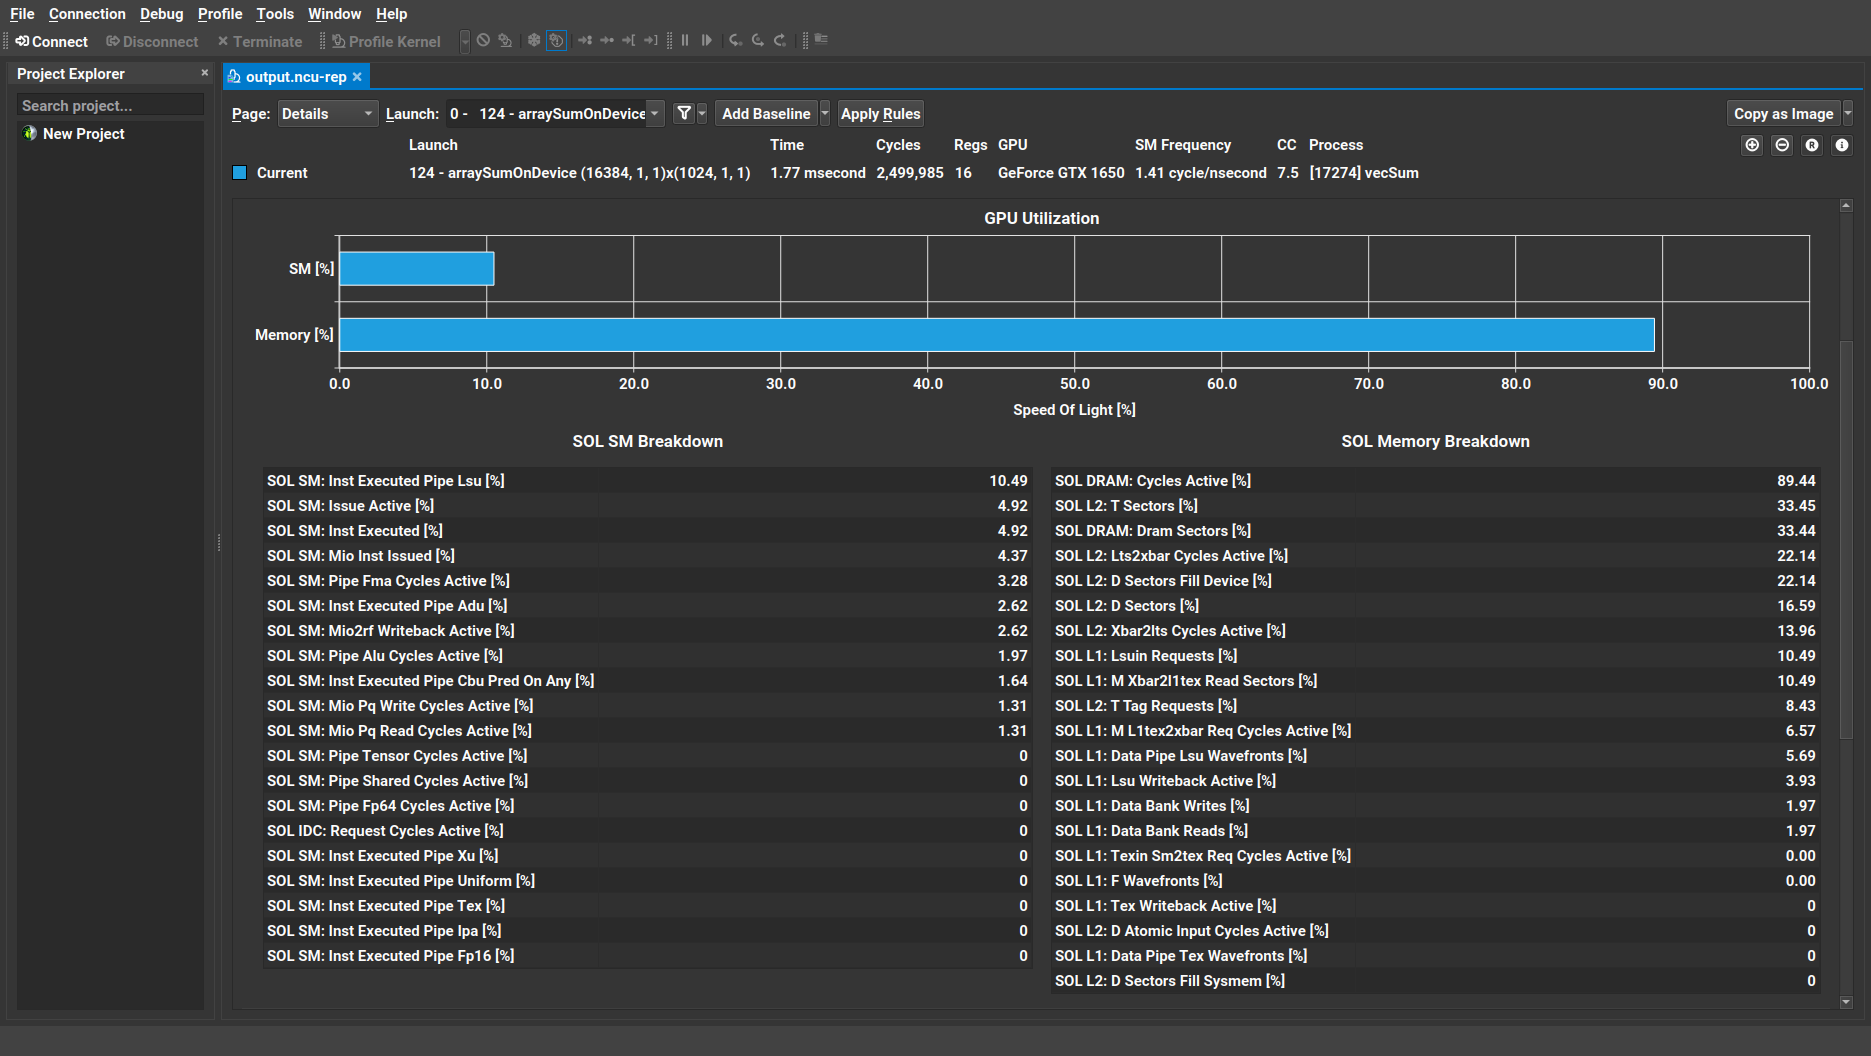
Hovering the mouse pointer over any of the breakdown items provides the description of the corresponding metric in a pop-up tooltip balloon. The user can easily customize each section. See the documentation for further details.
By default, Nsight Compute applies all applicable rules to the results once the profiling process in complete. The resulting operation data from applying these rules will be shown as Recommendations. These rule results, often marked by a warning icon, are mostly informative and give warnings on performance problems and guide the user throughout the performance optimization process. Comments can also be added to each section of the Details page by clicking on the comment (ballon) button at the right-hand side of the header tabs. These comments will be summarized in the Comments page.
The Source page incorporates the Shader Assembly (SASS), high-level code with pertinent metrics and Parallel Thread Execution (PTX) Instruction Set Architecture (ISA). The main focus of the Source page is only on the SASS functions that were called during the kernel launch.
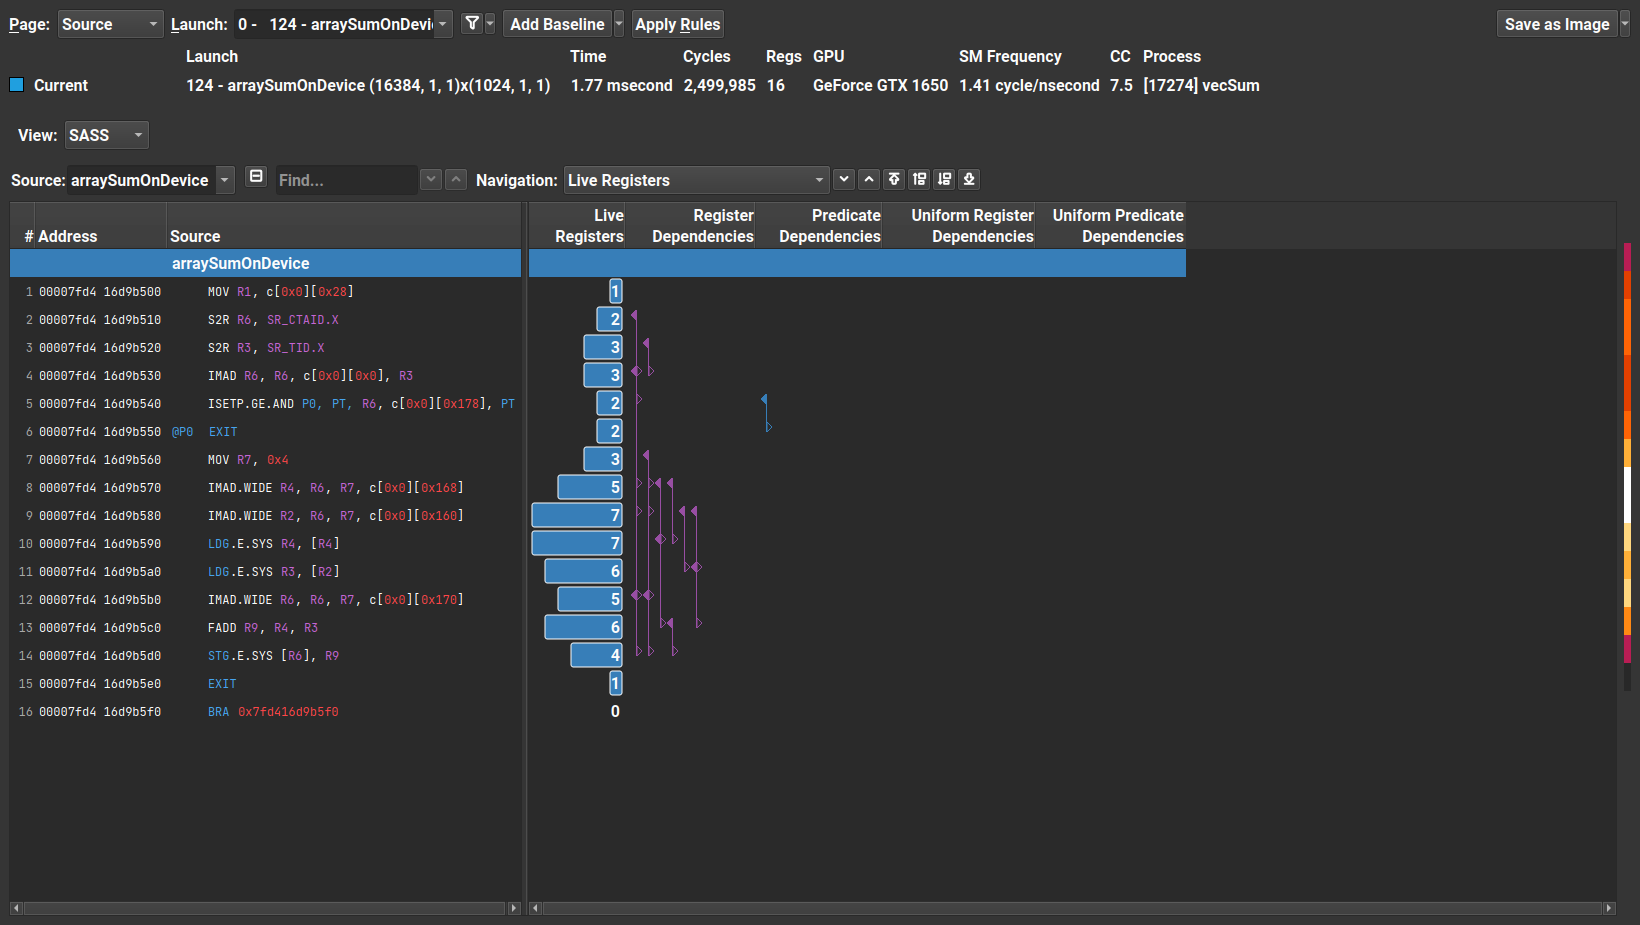
At this point, we do not go over the details of the Source page. However, the interested reader is referred to the Nsight Compute documentation for further details.
All thread-specific NVTX context data pertinent to each kernel launch is collected in the NVTX page if the NVTX support is enabled before starting the profiling process. The Raw page tabulates all collected metrics for each kernel execution and allows the exportation of the results in the CSV format for further investigation.
3.2.2. Importing Report Files in Nsight Compute’s GUI Profiler
Similar to the Nsight System GUI profiler which can be used to import the report files generated by its CLI or GUI profiler counterparts,
the Nsight Compute GUI can also be adopted to import the report files generated by its CLI/GUI profiler counterparts. The user can import the
report files either through the Open Files button within the Files menu(or using Ctrl+O shortcut keys.
The NVIDIA Nsight Compute Project files (with ncu-proj extension)
can host multiple report files and also incorporate notes and source codes for future reference. At any given NVIDIA Nsight Compute session, only one
Project file can be open and all collected reports will be assigned to the current project.
Key Points
NVIDIA Nsight Systems CLI profiler
NVIDIA Nsight Systems GUI profiler
NVIDIA Nsight Compute CLI profiler
NVIDIA Nsight Compute GUI profiler