
Working with NumPy Arrays#
Overview
Questions:
How do I use NumPy arrays?
Objectives:
Use functions in
numpyto read in tabular data from comma separated value files.Access information in a numpy array using column names and row numbers.
Learn about array axes.
NumPy, short for Numerical Python, is a powerful library that provides support for working with large, multi-dimensional arrays and matrices, along with a collection of mathematical functions to operate on these data structures. It is widely used in scientific computing, data analysis, and machine learning for tasks that require numerical computations on large data sets.
In this module we will focus on reading in and analyzing numerical data, visualizing the data, and working with arrays.
Reading text from files#
As we already discussed, there are many ways to read in data from files in Python. In our last module, we used the readlines() function to read in a complex output file. In theory, you could always use the readlines() function, and then use the data parsing tools we learned in the previous module to format the data as you needed. But sometimes there are other ways that make more sense, particularly if the data is formatted in a table.
A common table format is the CSV file or comma separated values.
This is exactly what it sounds like.
Data is presented in rows, with each value separated by a comma.
If you have data in a spreadsheet program that you need to import into a python code, you can save the data as a csvfile to read it in.
In this lesson, we are going to read in the data using a library called NumPy.
NumPy has a data type called an array.
In this example, we have a CSV file that contains data from analysis of a molecular dynamics trajectory. We have a 20 ns simulation that used a 2 fs timestep. The data was saved to the trajectory file every 1000 steps, so our file has 10,000 timesteps. At each timestep, we are interested in the distance between particular atoms. These trajectories were generated with the AMBER molecular dynamics program and the distances were measured with the Python program MDAnalysis. The table of atomic distances was saved as a CSV file called “distance_data_headers.csv”. This file was downloaded as part of your lesson materials. Open the file in a text editor and study it to determine its structure.
In analyzing tabular data, we often need to perform the same types of calculations (averaging, calculating the minimum or maximum of the data set), so we are once again going to use a Python library, this time a library that contains lots of functions to work with numerical data.
The first thing we will do is import the NumPy library. When NumPy is imported, it is often shortened to np
import numpy as np
The function we will use is called np.genfromtxt.
NumPy has a page on reading data from files in its documentation.
In the Jupyter environment, you can find out more about this function by doing
help(np.genfromtxt)
Library Documentation
Most popular Python libraries have very good online documentation.
You can find the pandas documentation by googling “numpy docs”.
You will be able to find the same help message you get for genfromtxt as well as tutorials and other types of documentation.
The help output shows us all the options we can use with this function.
The first input fname is the filename we are reading in.
We must put a values for this option because it does not have a default value.
All the other options have a default value that is shown after the = sign.
We only need to specify these options if we don’t want to use the default value.
For example, in our file, all the values were not numbers so we don’t want to use the datatype float, we want to use something else. If you have mixed datatypes, like we do here, we want to use ‘unicode’. In our file, our values are separated by commas; we indicate that with delimiter=','.
Should you skip the headers?
The clever student may notice the skip_header option, where you can specify a number of lines to skip at the beginning of the file. If we did this, then our values would all be numbers and we could use dtype=’float’, which is the default. In this example, we are not going to do that because we might want to use the headers later to label things, but keep this option in mind because you might want to use it in a later project.
To get started, we will make a variable for our file path, then use that variable in the np.genfromtxt function.
distance_file = "data/distance_data_headers.csv"

distances = np.genfromtxt(distance_file, delimiter=",", dtype="unicode")
The variable called distances is a NumPy Array.
distances
array([['Frame', 'THR4_ATP', 'THR4_ASP', 'TYR6_ATP', 'TYR6_ASP'],
       ['1', '8.9542', '5.8024', '11.5478', '9.9557'],
       ['2', '8.6181', '6.0942', '13.9594', '11.6945'],
       ...,
       ['9998', '8.6625', '7.7306', '9.5469', '10.3063'],
       ['9999', '9.2456', '7.8886', '9.8151', '10.7564'],
       ['10000', '8.8135', '7.917', '9.9517', '10.7848']], dtype='<U8')
The output of this function resembles a list of lists; that is, each row is a entry in our list, but each row is itself a list of values. We can see that the first row is our column headings and all the other rows contain numerical data.
If we were to read this in with the readlines() function, we would have to split each line of the file, use the append function to make a new list for each row, and THEN put all those lists together into a list of lists. Using the appropriate numpy function makes our life much easier.
Features of NumPy Arrays#
The variable distances resembles a lists of lists, but it is actually a data type called a NumPy array.
In contrast to a list, a NumPy array can have multiple dimensions.
In our case, it has rows and colums, or it has two dimensions.
We can see this by using the np.ndim function.
np.ndim(distances)
2
We can also see the number of rows and columns in our array by using the np.shape function
np.shape(distances)
(10001, 5)
Manipulating Data in the Array#
Even now, we can see that our first line of data is headings for our columns, and will need to be stored as strings, whereas all the rest of the data is numerical and will need to be stored as floats. Let’s take a slice of the data that is just the headers.
headers = distances[0]
print(headers)
['Frame' 'THR4_ATP' 'THR4_ASP' 'TYR6_ATP' 'TYR6_ASP']
We can use the same slicing syntax we learned in earlier lessons to get the numerical values in the array.
data = distances[1:]
print(data)
[['1' '8.9542' '5.8024' '11.5478' '9.9557']
 ['2' '8.6181' '6.0942' '13.9594' '11.6945']
 ['3' '9.0066' '6.0637' '13.0924' '11.3043']
 ...
 ['9998' '8.6625' '7.7306' '9.5469' '10.3063']
 ['9999' '9.2456' '7.8886' '9.8151' '10.7564']
 ['10000' '8.8135' '7.917' '9.9517' '10.7848']]
Even though we now have a NumPy array that is just the numbers, the numbers are all still strings. We know this because (1) we read them all in as unicode and (2) if we look at the output of the print statement, we can see that each number is enclosed in single quotes, indicating that it is a string. We need to recast these values as floats. The numpy library has a built-in function to accomplish this. In this case, keeping a variable with all the same information as strings is not useful to us, so this is a case where we are going to overwrite our variable data.
data = data.astype(float)
print(data)
[[1.00000e+00 8.95420e+00 5.80240e+00 1.15478e+01 9.95570e+00]
 [2.00000e+00 8.61810e+00 6.09420e+00 1.39594e+01 1.16945e+01]
 [3.00000e+00 9.00660e+00 6.06370e+00 1.30924e+01 1.13043e+01]
 ...
 [9.99800e+03 8.66250e+00 7.73060e+00 9.54690e+00 1.03063e+01]
 [9.99900e+03 9.24560e+00 7.88860e+00 9.81510e+00 1.07564e+01]
 [1.00000e+04 8.81350e+00 7.91700e+00 9.95170e+00 1.07848e+01]]
We already learned how to address a particular element of a list and how to take a slice of a list to create a new list. Now that we have an array, we now need two indices to address a particular element of the array. The notation to address an element of the array is always
array_name[row_index, column_index]
# This will get the first row and the second column.
data[0, 1]
np.float64(8.9542)
Check Your Understanding
What would be the output of these lines of code?
print(data[0,1])
print(data[1,0])
Solution
8.9542
2.0
Slicing#
Similar to lists, you can also slice numpy arrrays. This allows you to get a range of rows or columns. To take a slice, you use a colon:
array_name[row_start:row_end, column_start, column_end]
small_data = data[0:10,0:3]
print(small_data)
[[ 1.      8.9542  5.8024]
 [ 2.      8.6181  6.0942]
 [ 3.      9.0066  6.0637]
 [ 4.      9.2002  6.0227]
 [ 5.      9.1294  5.9365]
 [ 6.      9.0462  6.2553]
 [ 7.      8.8657  5.9186]
 [ 8.      9.3256  6.2351]
 [ 9.      9.4184  6.1993]
 [10.      9.06    6.0478]]
Remember that counting starts at zero, so 0:10 means start at row zero and include all rows, up to but not including 10.
Just as with the one-dimensional list slices, if you don’t include a number before the : the slice automatically starts with index 0. If you don’t include a number after the : the slice goes to the end of the array. Therefore, if you don’t include either, a : means every row or every column.
Check Your Understanding
What would be the output of these lines of code?
print(small_data[5,:])
print(small_data[:,1:])
Solution
The first print statement selects one particular row and every column.
[6. 9.0462 6.2553]
The second print statement selects every row, and all the columns except the first one.
[[8.9542 5.8024]
 [8.6181 6.0942]
 [9.0066 6.0637]
 [9.2002 6.0227]
 [9.1294 5.9365]
 [9.0462 6.2553]
 [8.8657 5.9186]
 [9.3256 6.2351]
 [9.4184 6.1993]
 [9.06   6.0478]]
Analyzing Tabular Data#
The numpy library has numerous built-in functions. For example, to calculate the average (mean) of a data set, we could use the np.mean function
np.mean(data)
np.float64(1008.184506144)
This gives us the mean of all the numbers in the array. Using what we have learned so far, we could use array slicing to determine the average of the first column of data.
thr4_atp = data[:,1]  # Every row, just the THR4_ATP column
avg_thr4_atp = np.mean(thr4_atp)
print(avg_thr4_atp)
10.876950930000001
This is correct, but now we would like to calculate the average of every column. This seems like a job for a for loop, but unlike last time, we don’t want to count over a particular list and do something for every item, we want to do something a particular number of times. Basically, we want to take that 1 and let it be every number, up to the number of columns. This is a task for the range() function. The general syntax is
range(start, end)
In our example, the “end” value needs to be the number of columns of data.
num_columns = len(headers)
print(num_columns)
5
Now that we know the number of columns, we can use the range() function to set up our for loop.
for i in range(1,num_columns):
    column = data[:,i]
    avg_col = np.mean(column)
    print(F'{headers[i]} : {avg_col}')
THR4_ATP : 10.876950930000001
THR4_ASP : 7.342344959999999
TYR6_ATP : 11.209791329999998
TYR6_ASP : 10.9934435
NumPy Array Axes and Operations#
Although the for loop we just used worked, there is an easier way to perform operations on NumPy arrays
when you want to analyze rows or columns.
NumPy arrays have axes for each dimension.
For our array, we saw that it has two dimensions using np.ndim
Axis 0 goes down the rows, while axis 1 goes across the columns.
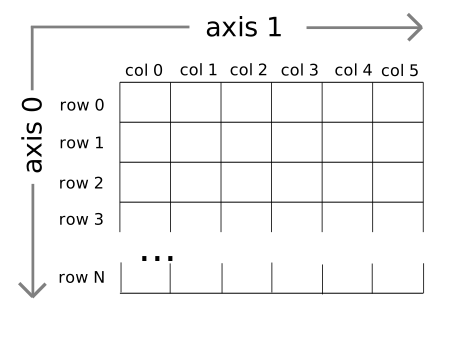
If we wanted to get the mean of every row, we could have added an axis
argument to our mean function.
To have the mean function applied to every column of data, we would use the axis=0 argument.
means = np.mean(data, axis=0)
print(means)
[5000.5 10.87695093 7.34234496 11.20979133 10.9934435 ]
If you compare the values calculated using this method and our forloop method,
you will see that they are the same values.
Using the axis keyword is usually the preferred method of analyzing NumPy arrays.
If you have a lot of data, using the axis argument will be noticeably faster than using a for loop with an array.
NumPy arrays have lots of other useful features that you can read about in NumPy’s beginner’s guide.
Check Your Understanding
Use the function np.std and the appropriate axis argument to find the standard deviation of each column. How could you exclude the frame number column in your calculation?
Solution
To find the standard deviation of each column, you can do
np.std(data, axis=0)
If you wanted to exclude the frame column, you could slide your array when performing the standard deviation calculation.
np.std(data[:, 1:], axis=0)
Element-Wise Operations#
A NumPy array also allows element-wise operations, or easily adding two arrays. For example, if we wanted to add a number to every element of our array, we could easily do that.
data + 2 # I am adding the number two to every array element. Notice that I am not saving this in a variable, so data is unchanged.
array([[3.00000e+00, 1.09542e+01, 7.80240e+00, 1.35478e+01, 1.19557e+01],
       [4.00000e+00, 1.06181e+01, 8.09420e+00, 1.59594e+01, 1.36945e+01],
       [5.00000e+00, 1.10066e+01, 8.06370e+00, 1.50924e+01, 1.33043e+01],
       ...,
       [1.00000e+04, 1.06625e+01, 9.73060e+00, 1.15469e+01, 1.23063e+01],
       [1.00010e+04, 1.12456e+01, 9.88860e+00, 1.18151e+01, 1.27564e+01],
       [1.00020e+04, 1.08135e+01, 9.91700e+00, 1.19517e+01, 1.27848e+01]])
This is in contrast to the behavior of a list.
# create a lists of lists
my_list = [[1, 2, 3], [4, 5, 6]]
print(my_list)
[[1, 2, 3], [4, 5, 6]]
my_list + 2
---------------------------------------------------------------------------
TypeError                                 Traceback (most recent call last)
Cell In[18], line 1
----> 1 my_list + 2

TypeError: can only concatenate list (not "int") to list
Fortunately, you can make any list into an array using np.array
my_array = np.array(my_list)
print(f"The data type of my_array is is {type(my_array)}")
my_array + 2
NumPy arrays are powerful data structures that you will see often if you regularly program in Python for data analysis. We strongly encourage you to read the NumPy’s beginner’s guide to learn more about NumPy arrays!
Key Points
You can use NumPy to read data from files.
NumPy arrays are multi-dimensional.
NumPy has many functions for numerical analysis.
You can use
rangein aforloop to perform something a certain number of times.forloops can sometimes be avoided in NumPy by using special array features like theaxisargument in analysis functions.